Contour Disease Risk Forecasting
The new Contour Disease Risk Forecasting tool is now available to subscribed accounts as a beta product.
The new tool provides access to forecast data showing the risk level of up to 90 key fungal diseases on each farm, covering 20 common crops.
The Disease Risk Forecast service can help you:
- Open doors on farm, with a new reason to go down a farm drive and start a conversation with a grower who doesn’t currently use Agrii services
- Have more targeted, timely sales conversations with the right growers who may need a particular product solution in the next 4 days
- Provide evidence demonstrating product need, given increasing market scrutiny
- Support IPM planning by evidencing risk and justifying control methods
- Diversify sales with timely data to support use of preventatives and biologicals
- Serve more farms by enabling more targeted visits
Here’s how:
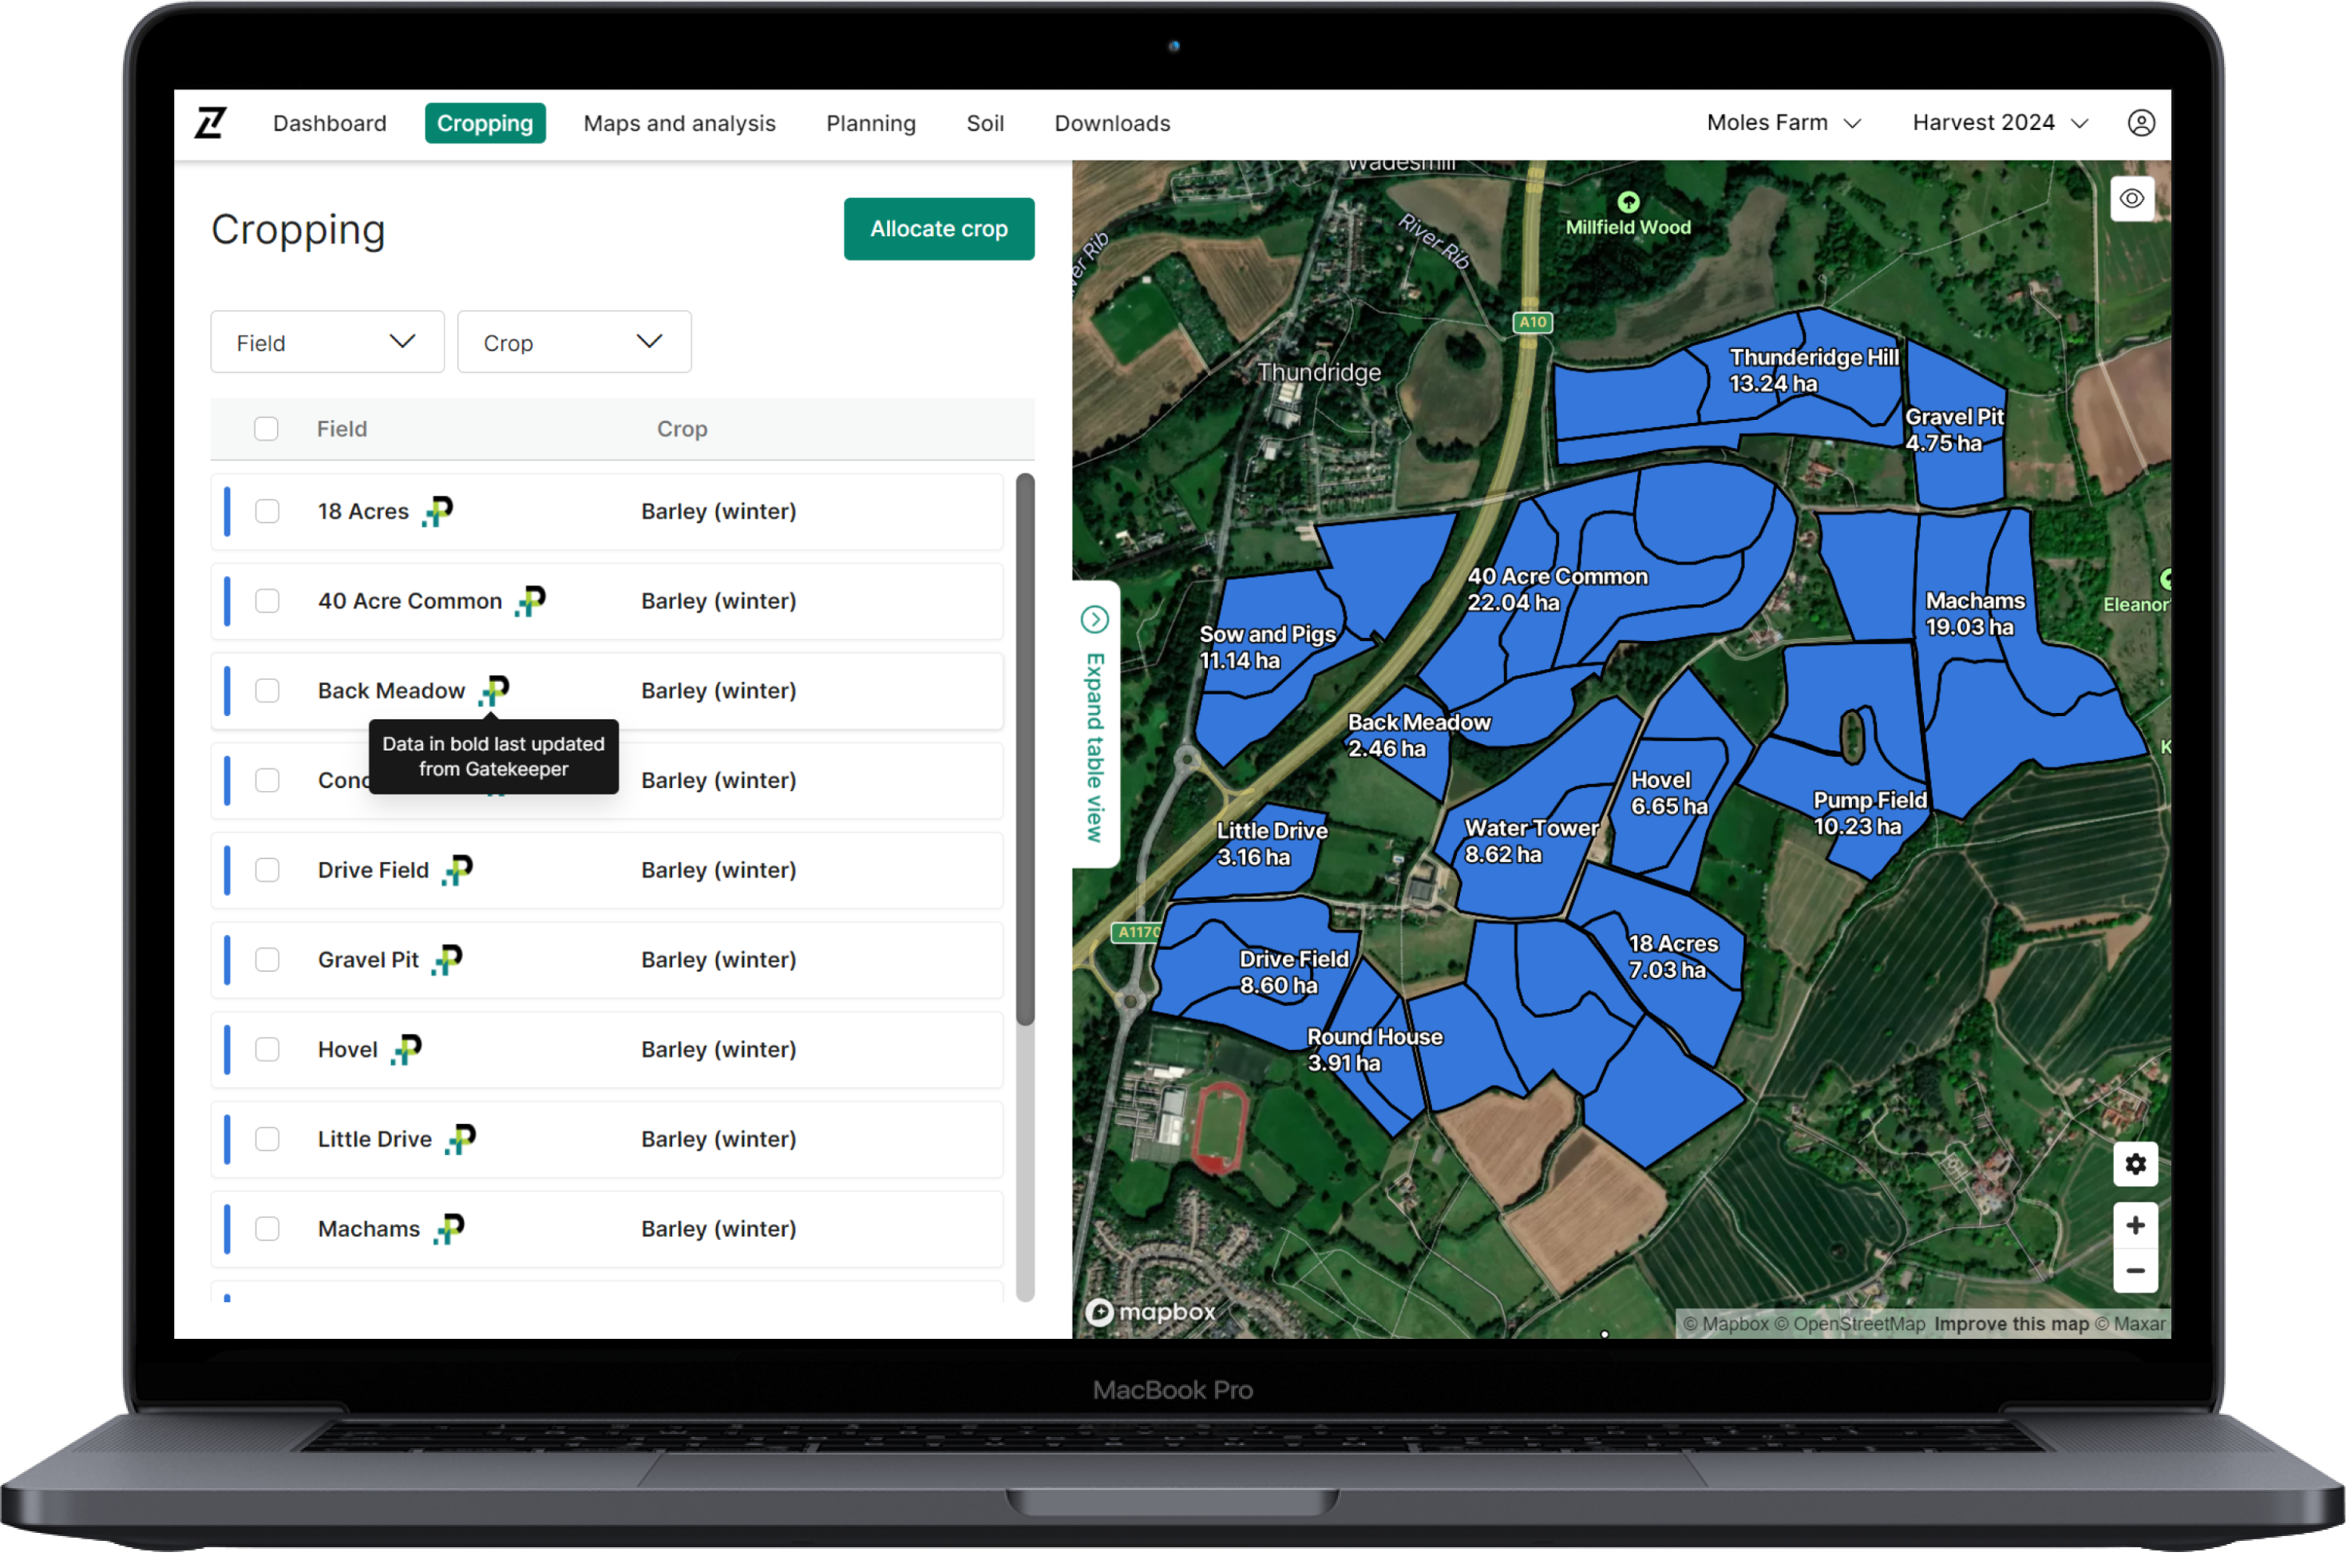
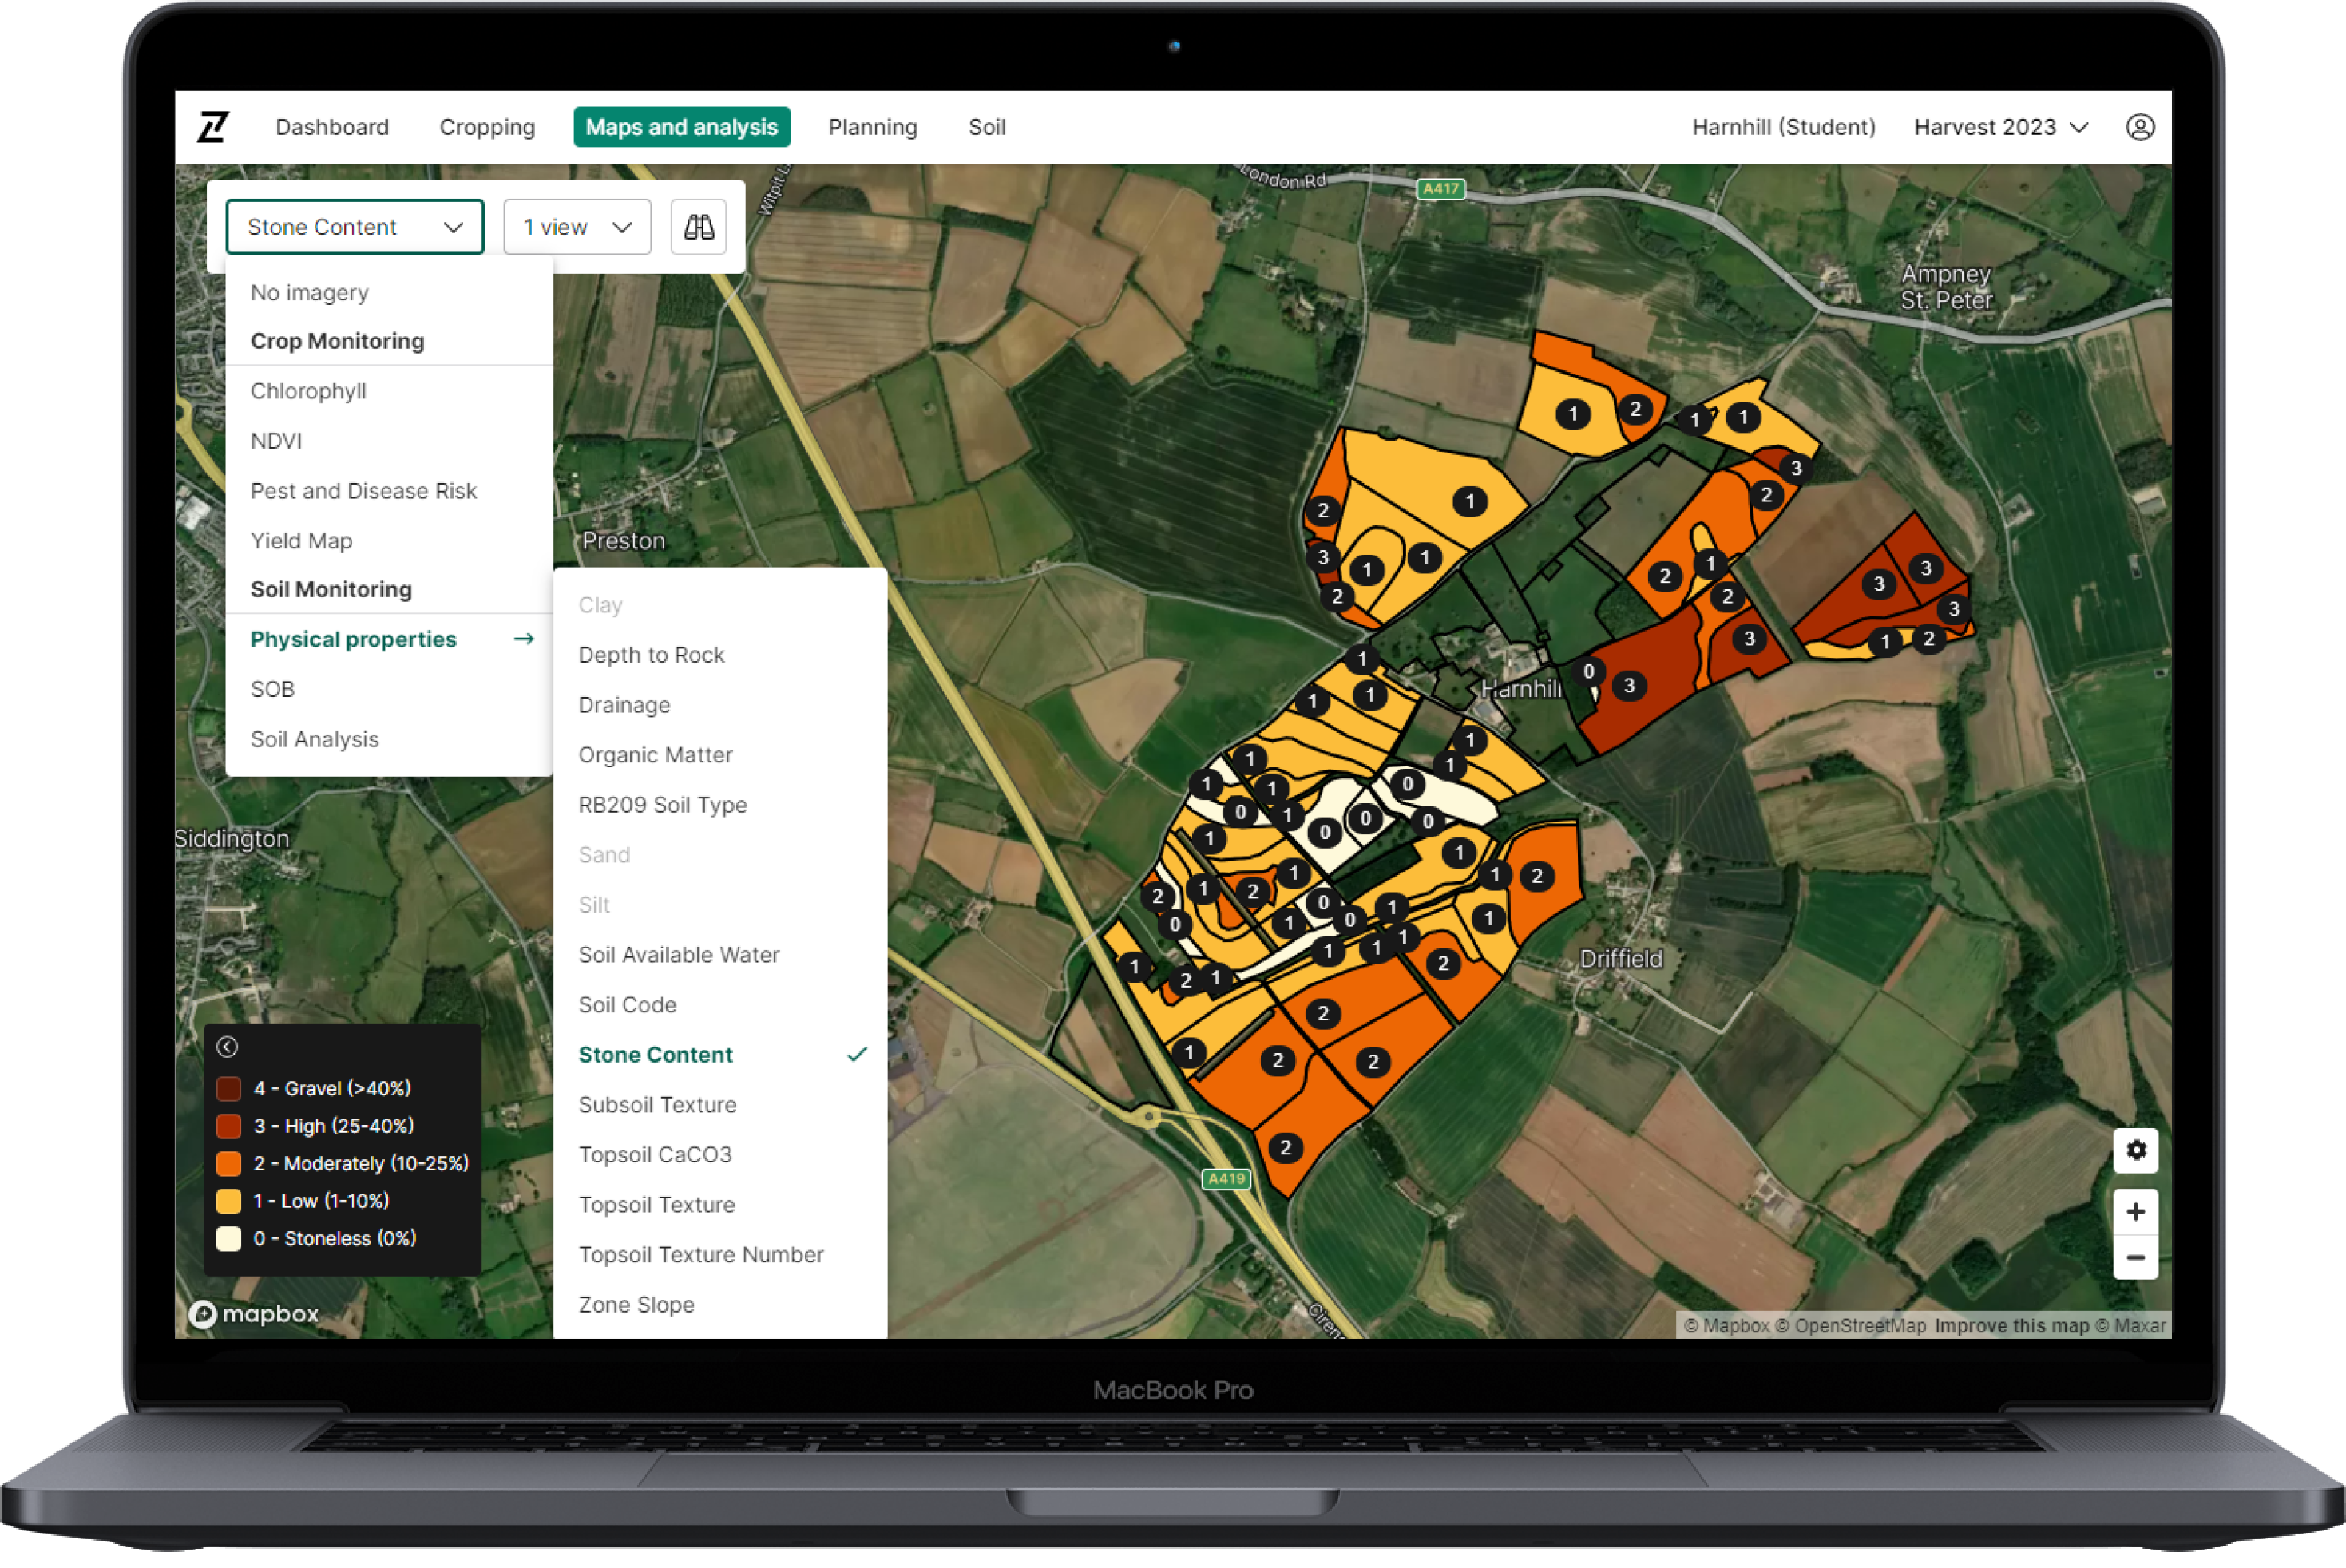
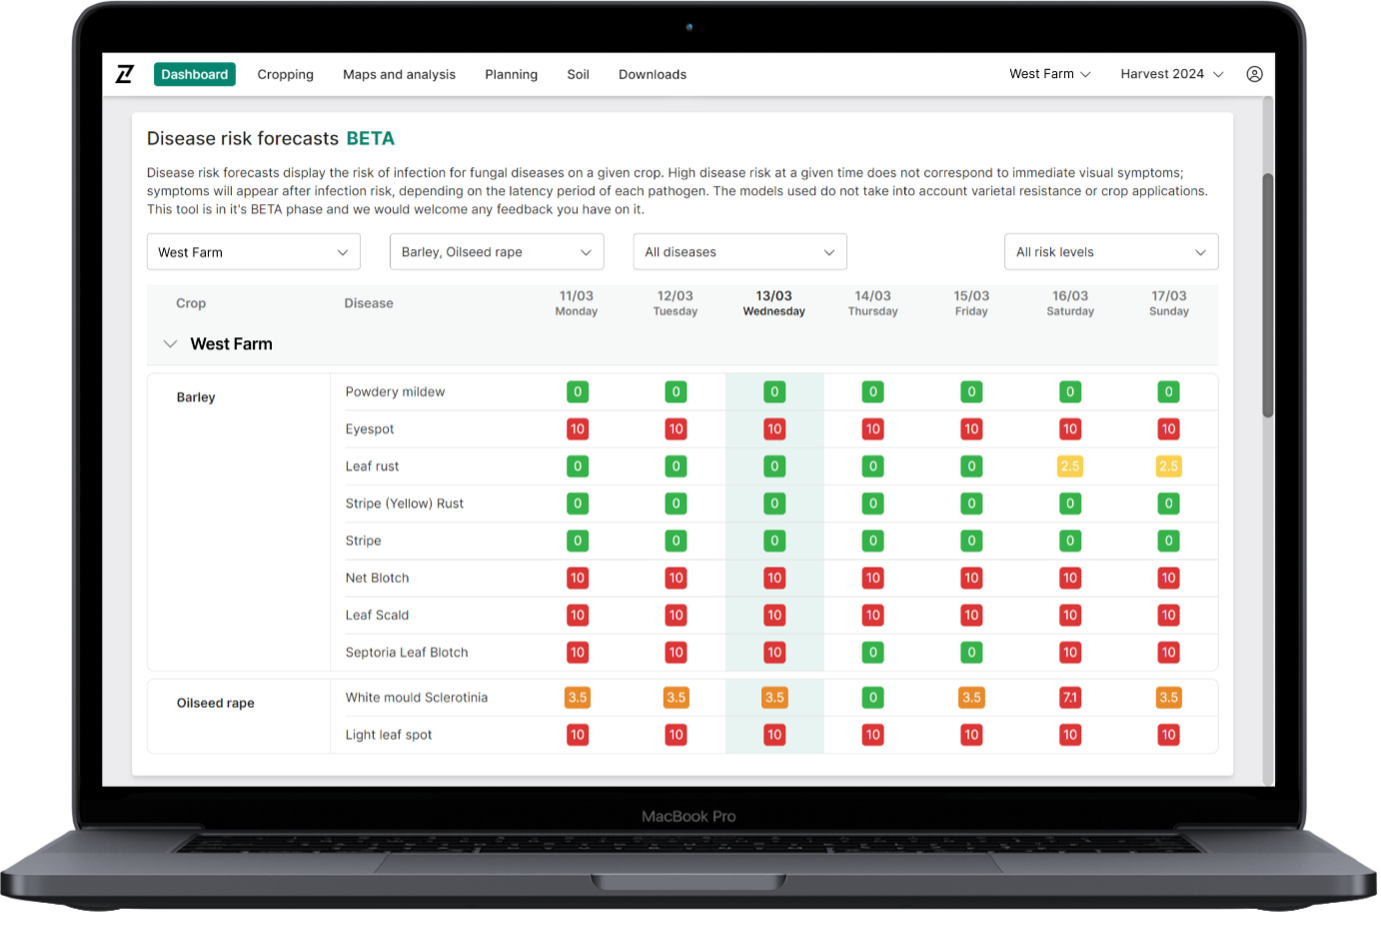
- Disease Risk is shown in a new area of the Contour dashboard for subscribed accounts, showing the risk of infection on each farm over the previous two days, today, and the next four days
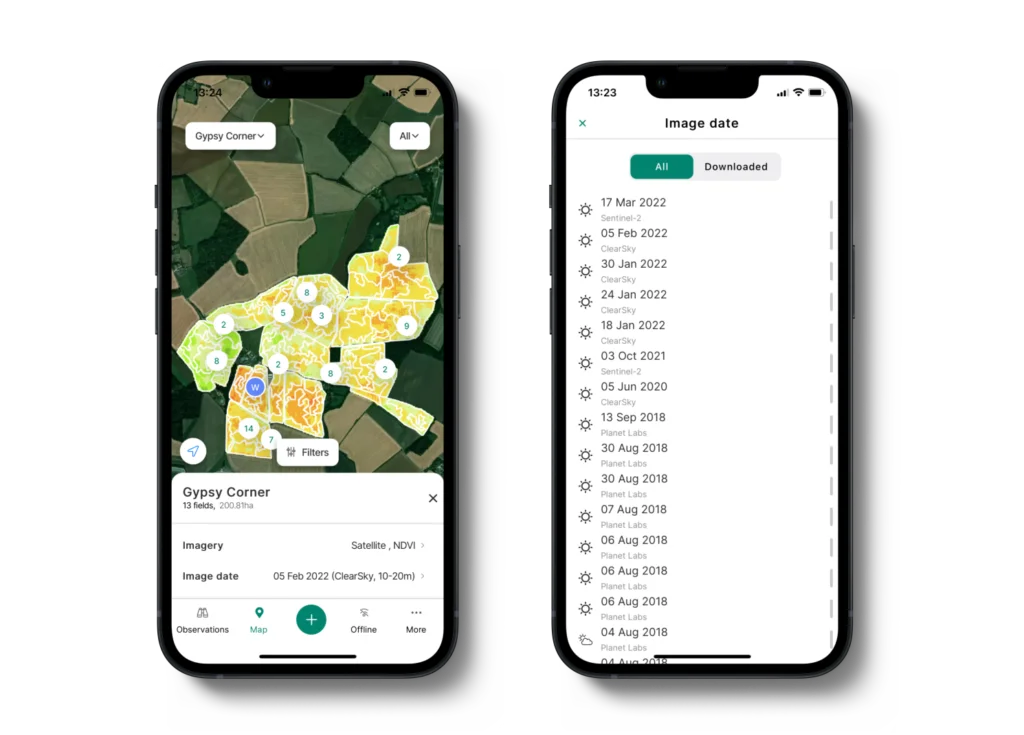
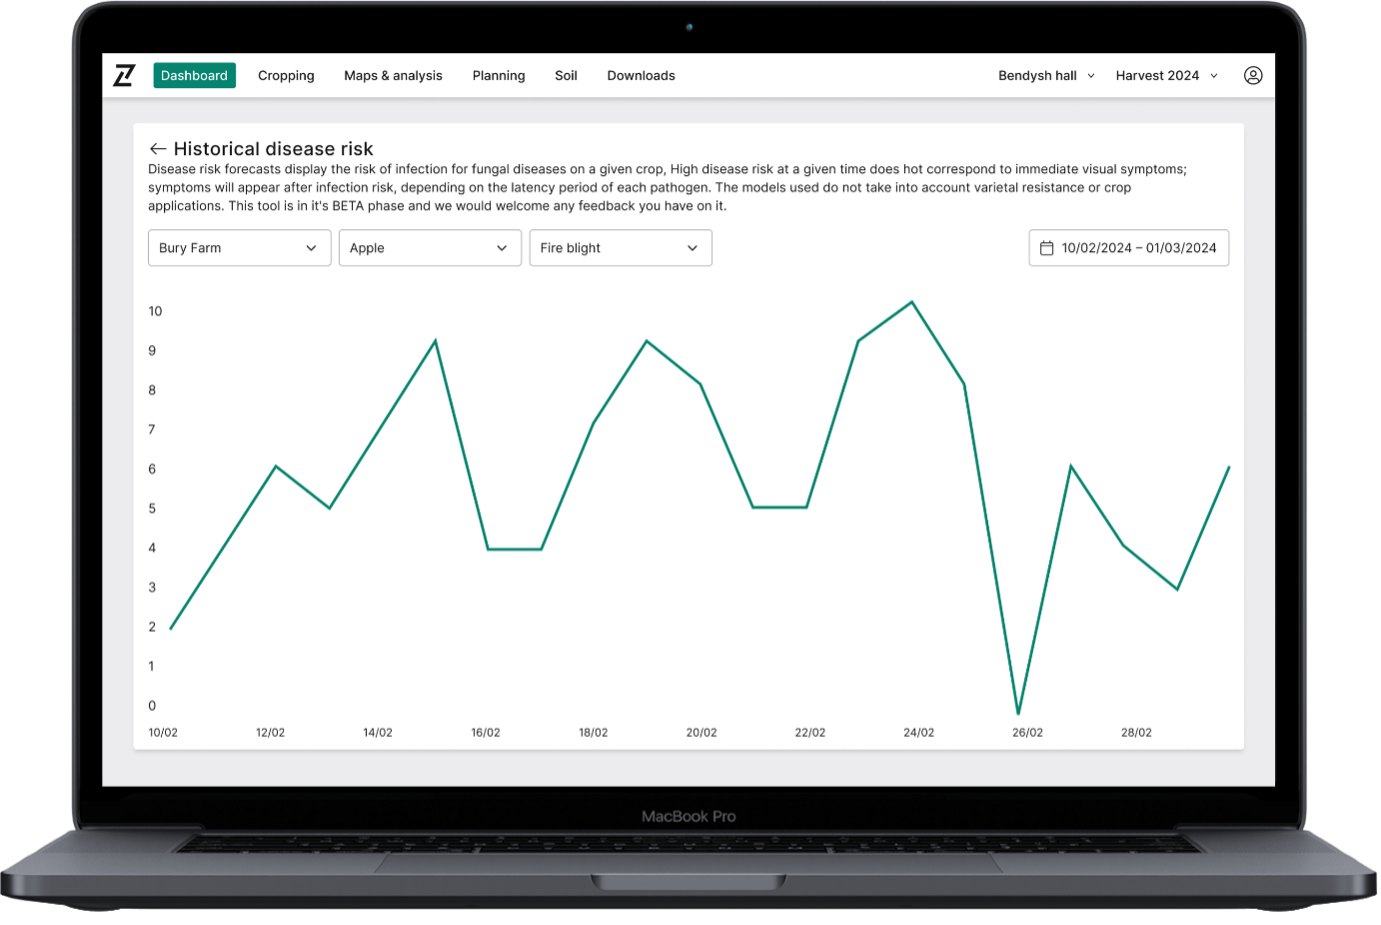
- Selecting a row in the Disease Risk table displays a historical time series of the risk for that particular disease, going back to when the service was switched on for that farm– providing evidence for past decisions based on the data
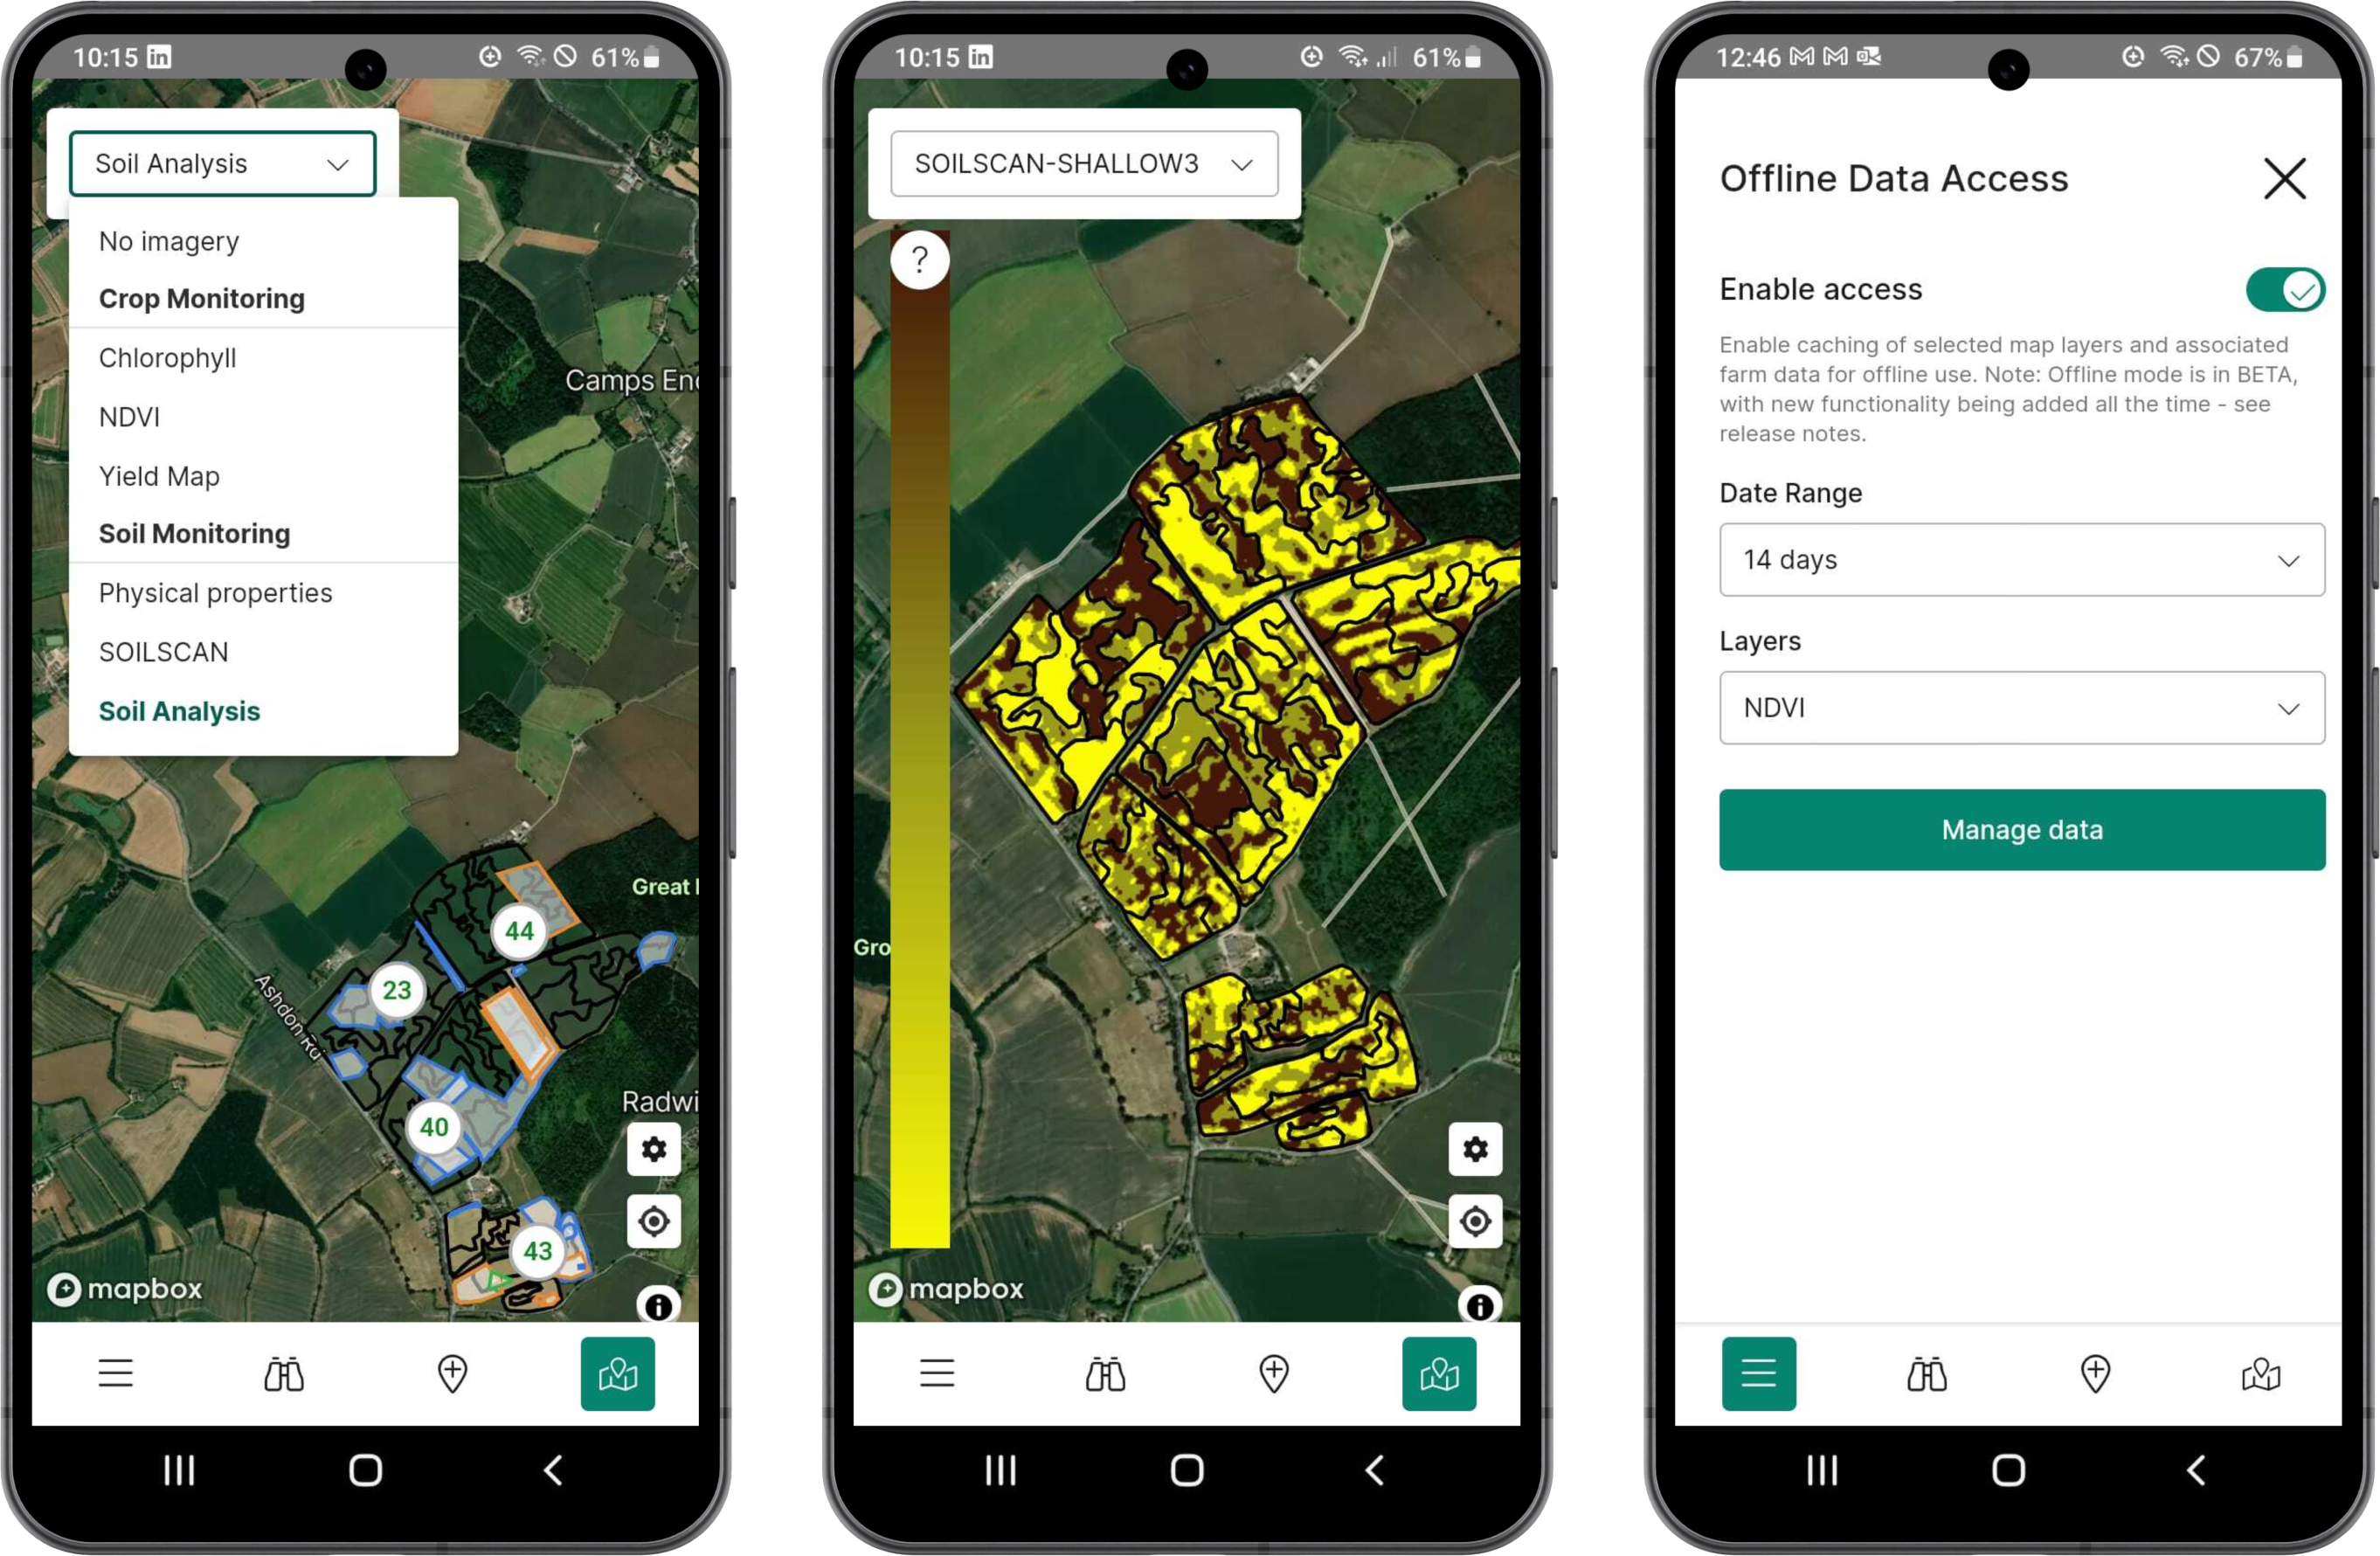
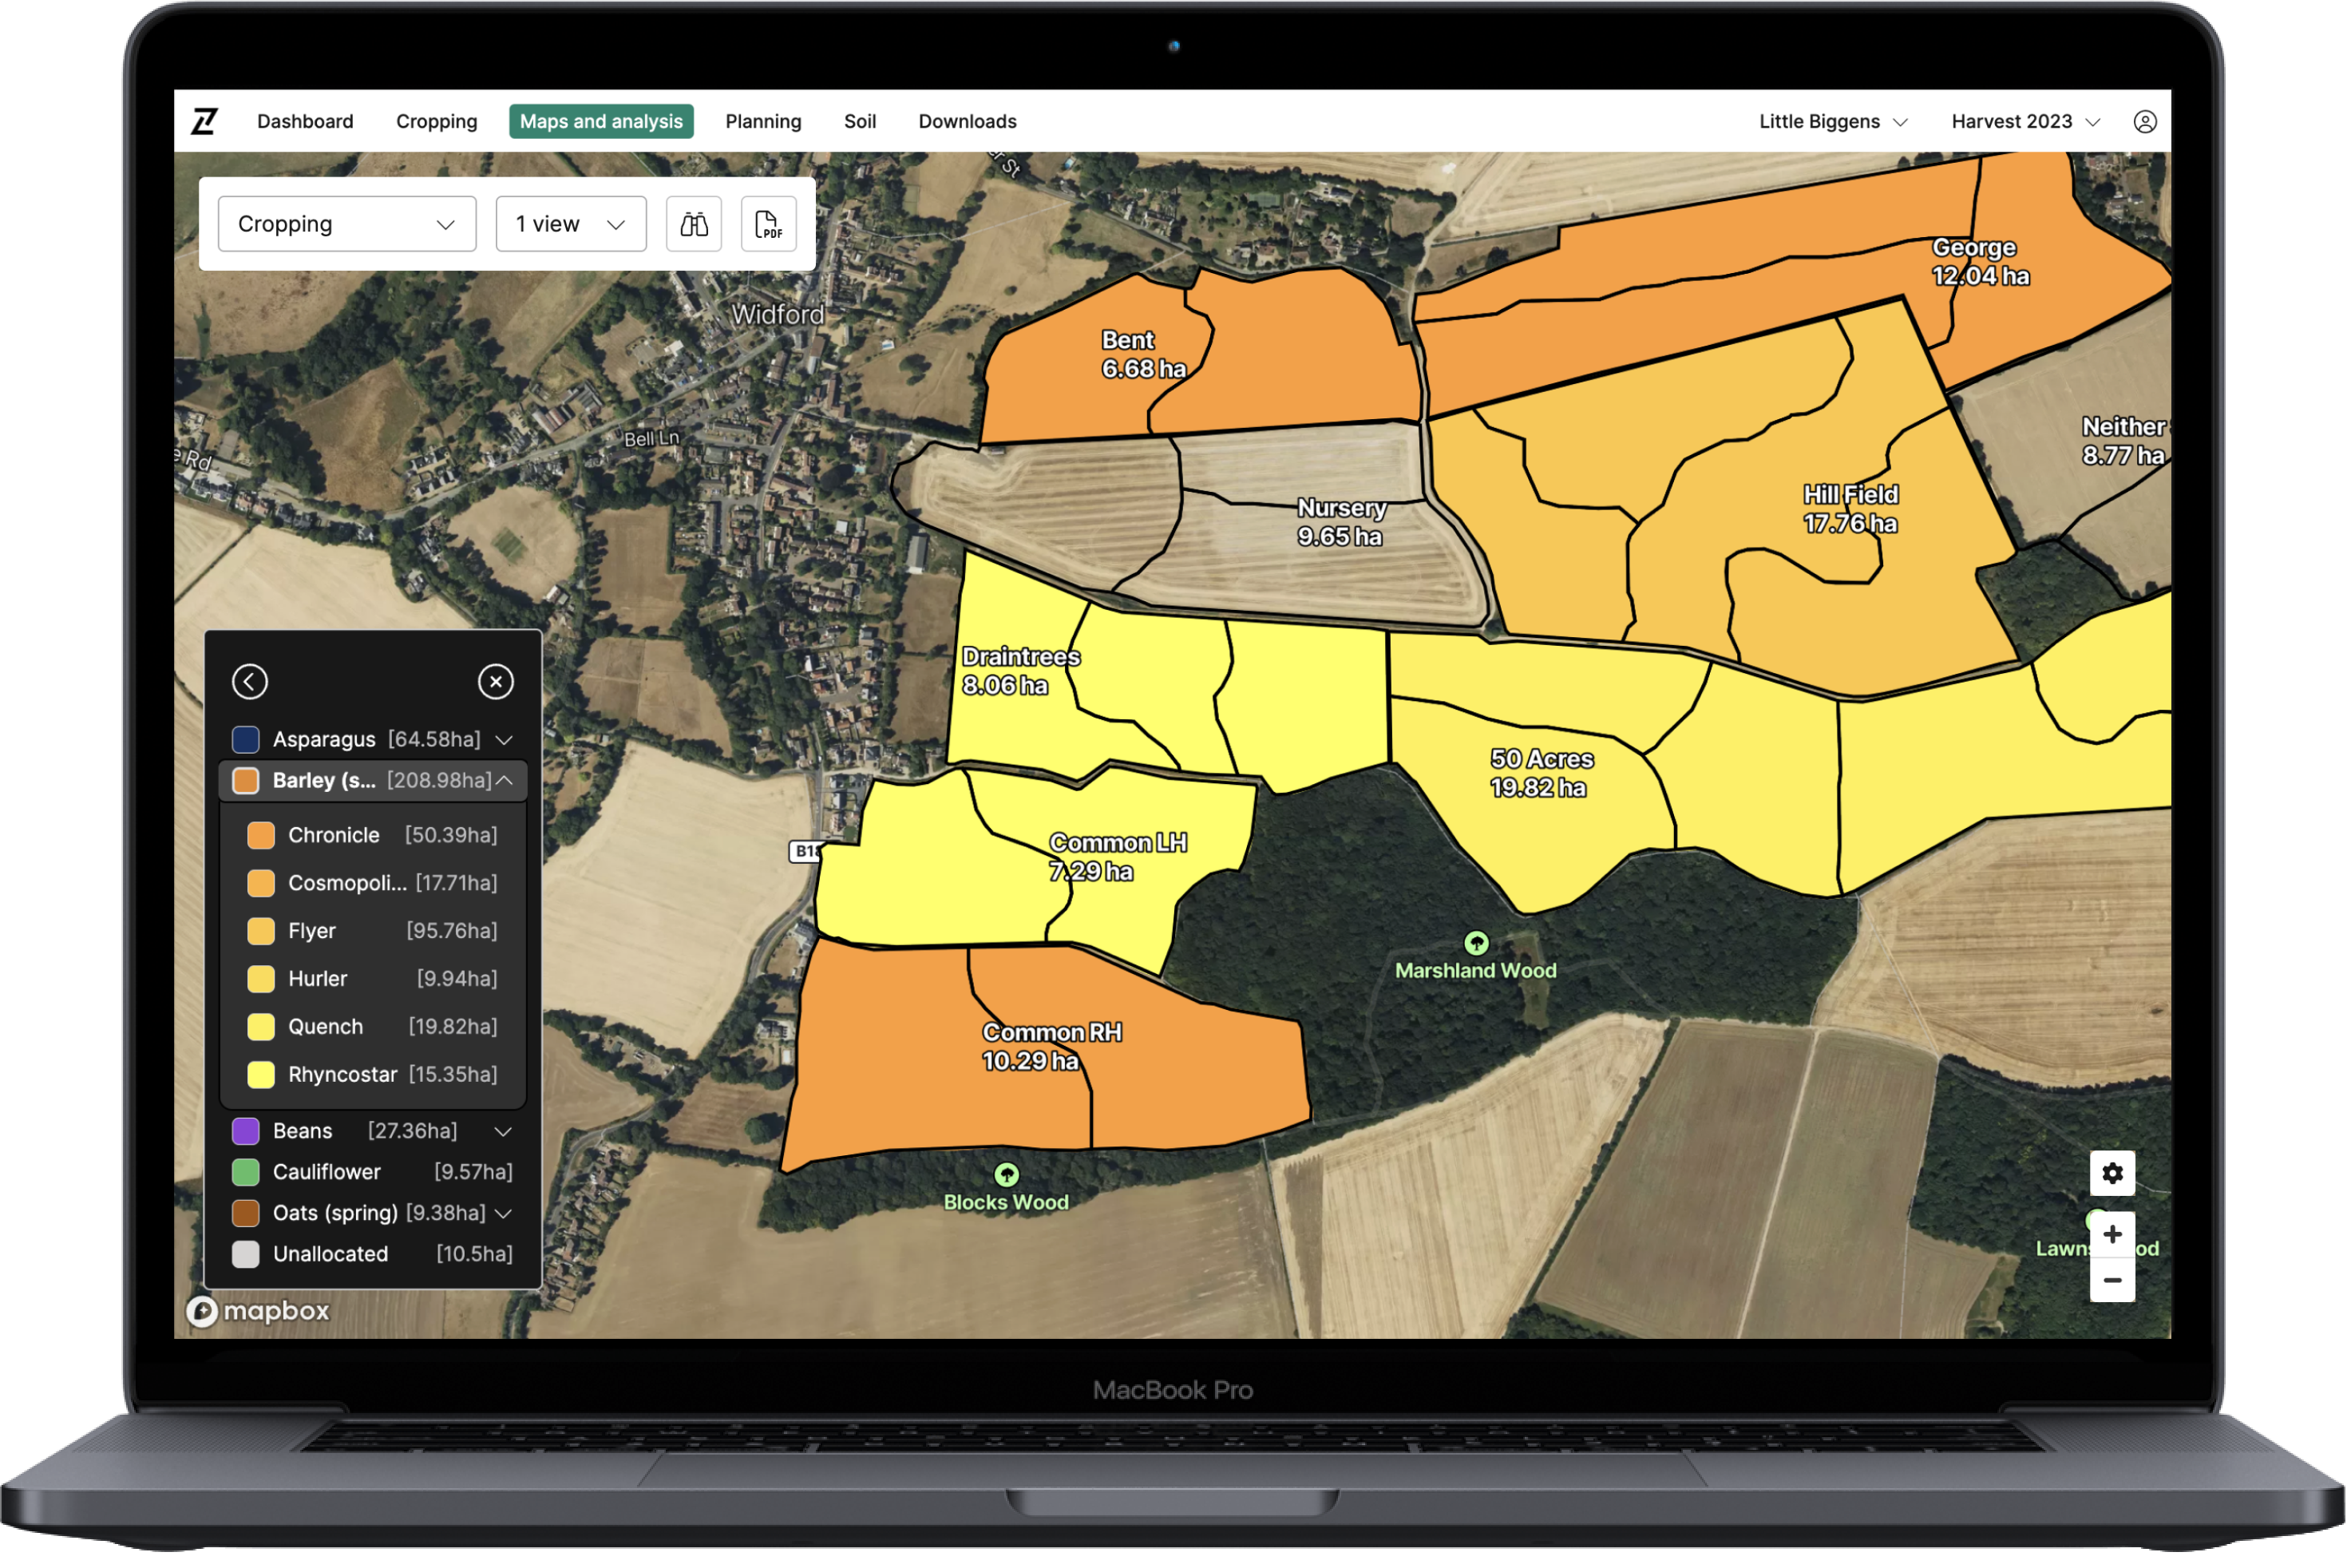
- Disease Risk Forecasts are specific to each farm based on the data in Contour: weather data for that farm’s precise location (up to 10 days forecast and 12 days historic weather at the farm centroid location), cropping, and soil type
- As well as the dashboard view showing risk for a single account, you can also receive Disease Risk data as a single CSV file showing risk across all Agrii UK accounts, emailed daily. If you would like to receive this, or have an account you want to subscribe, please contact RHIZA
- Disease models will run during the relevant time window for each crop (see further info below)
- Disease Risk models are provided by our partner AppsforAgri, who have been selected by Agrii R&D as the disease model provider of choice
Interpreting Disease Risk Scores
High disease risk at a given time does not correspond to immediate visual symptoms; symptoms will appear after infection risk, depending on the latency period of each pathogen. In addition, it is worth noting that the scores do not take varietal resistance, growth stage, or product applications into account.
For more information on what scores mean, and how to use Disease Risk forecasts to recommend action, download our guide here.
Further info:
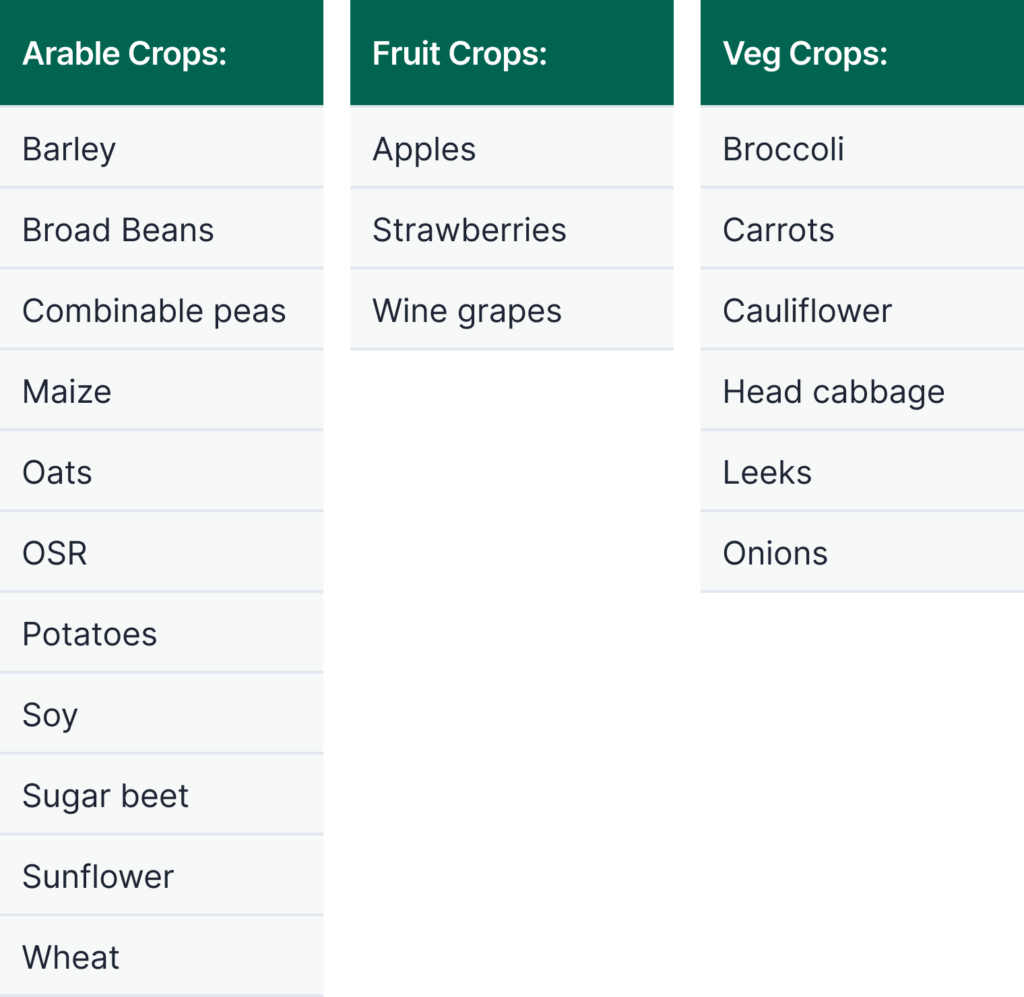
90 diseases across the following 20 crops are currently covered by the models:
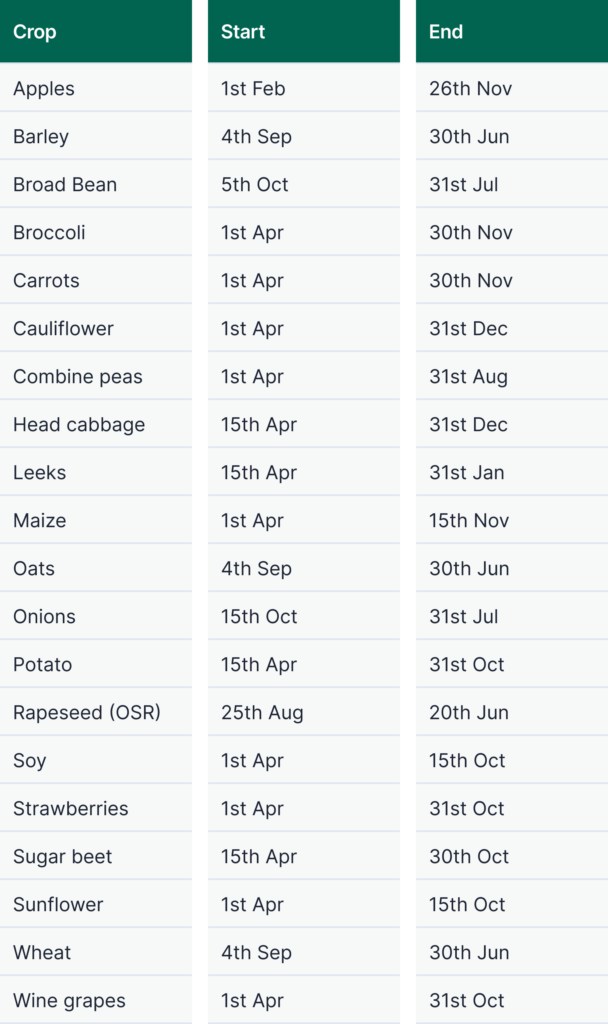
Models are run during the following windows for each crop:
Log in to Contour to check out the updates today, and please send any feedback you may have to info@digital.originenterprises.com to help us keep improving.