Contour 2.67 – Visualise full range of soil physical properties
Today’s update to Contour extends the recently introduced visualisation of clay, sand, & silt soil data to cover the full range of soil physical properties, allowing users to make further detailed comparisons to understand how soil characteristics are impacting biomass or crop health so that appropriate management practices can be implemented.
Here’s how:
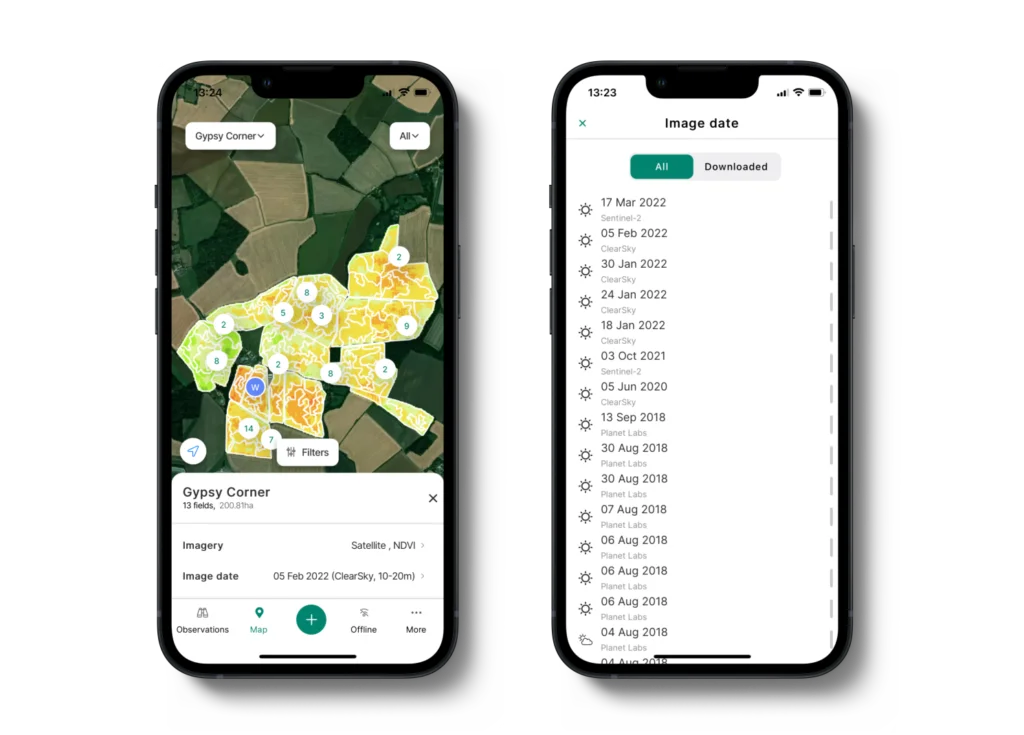
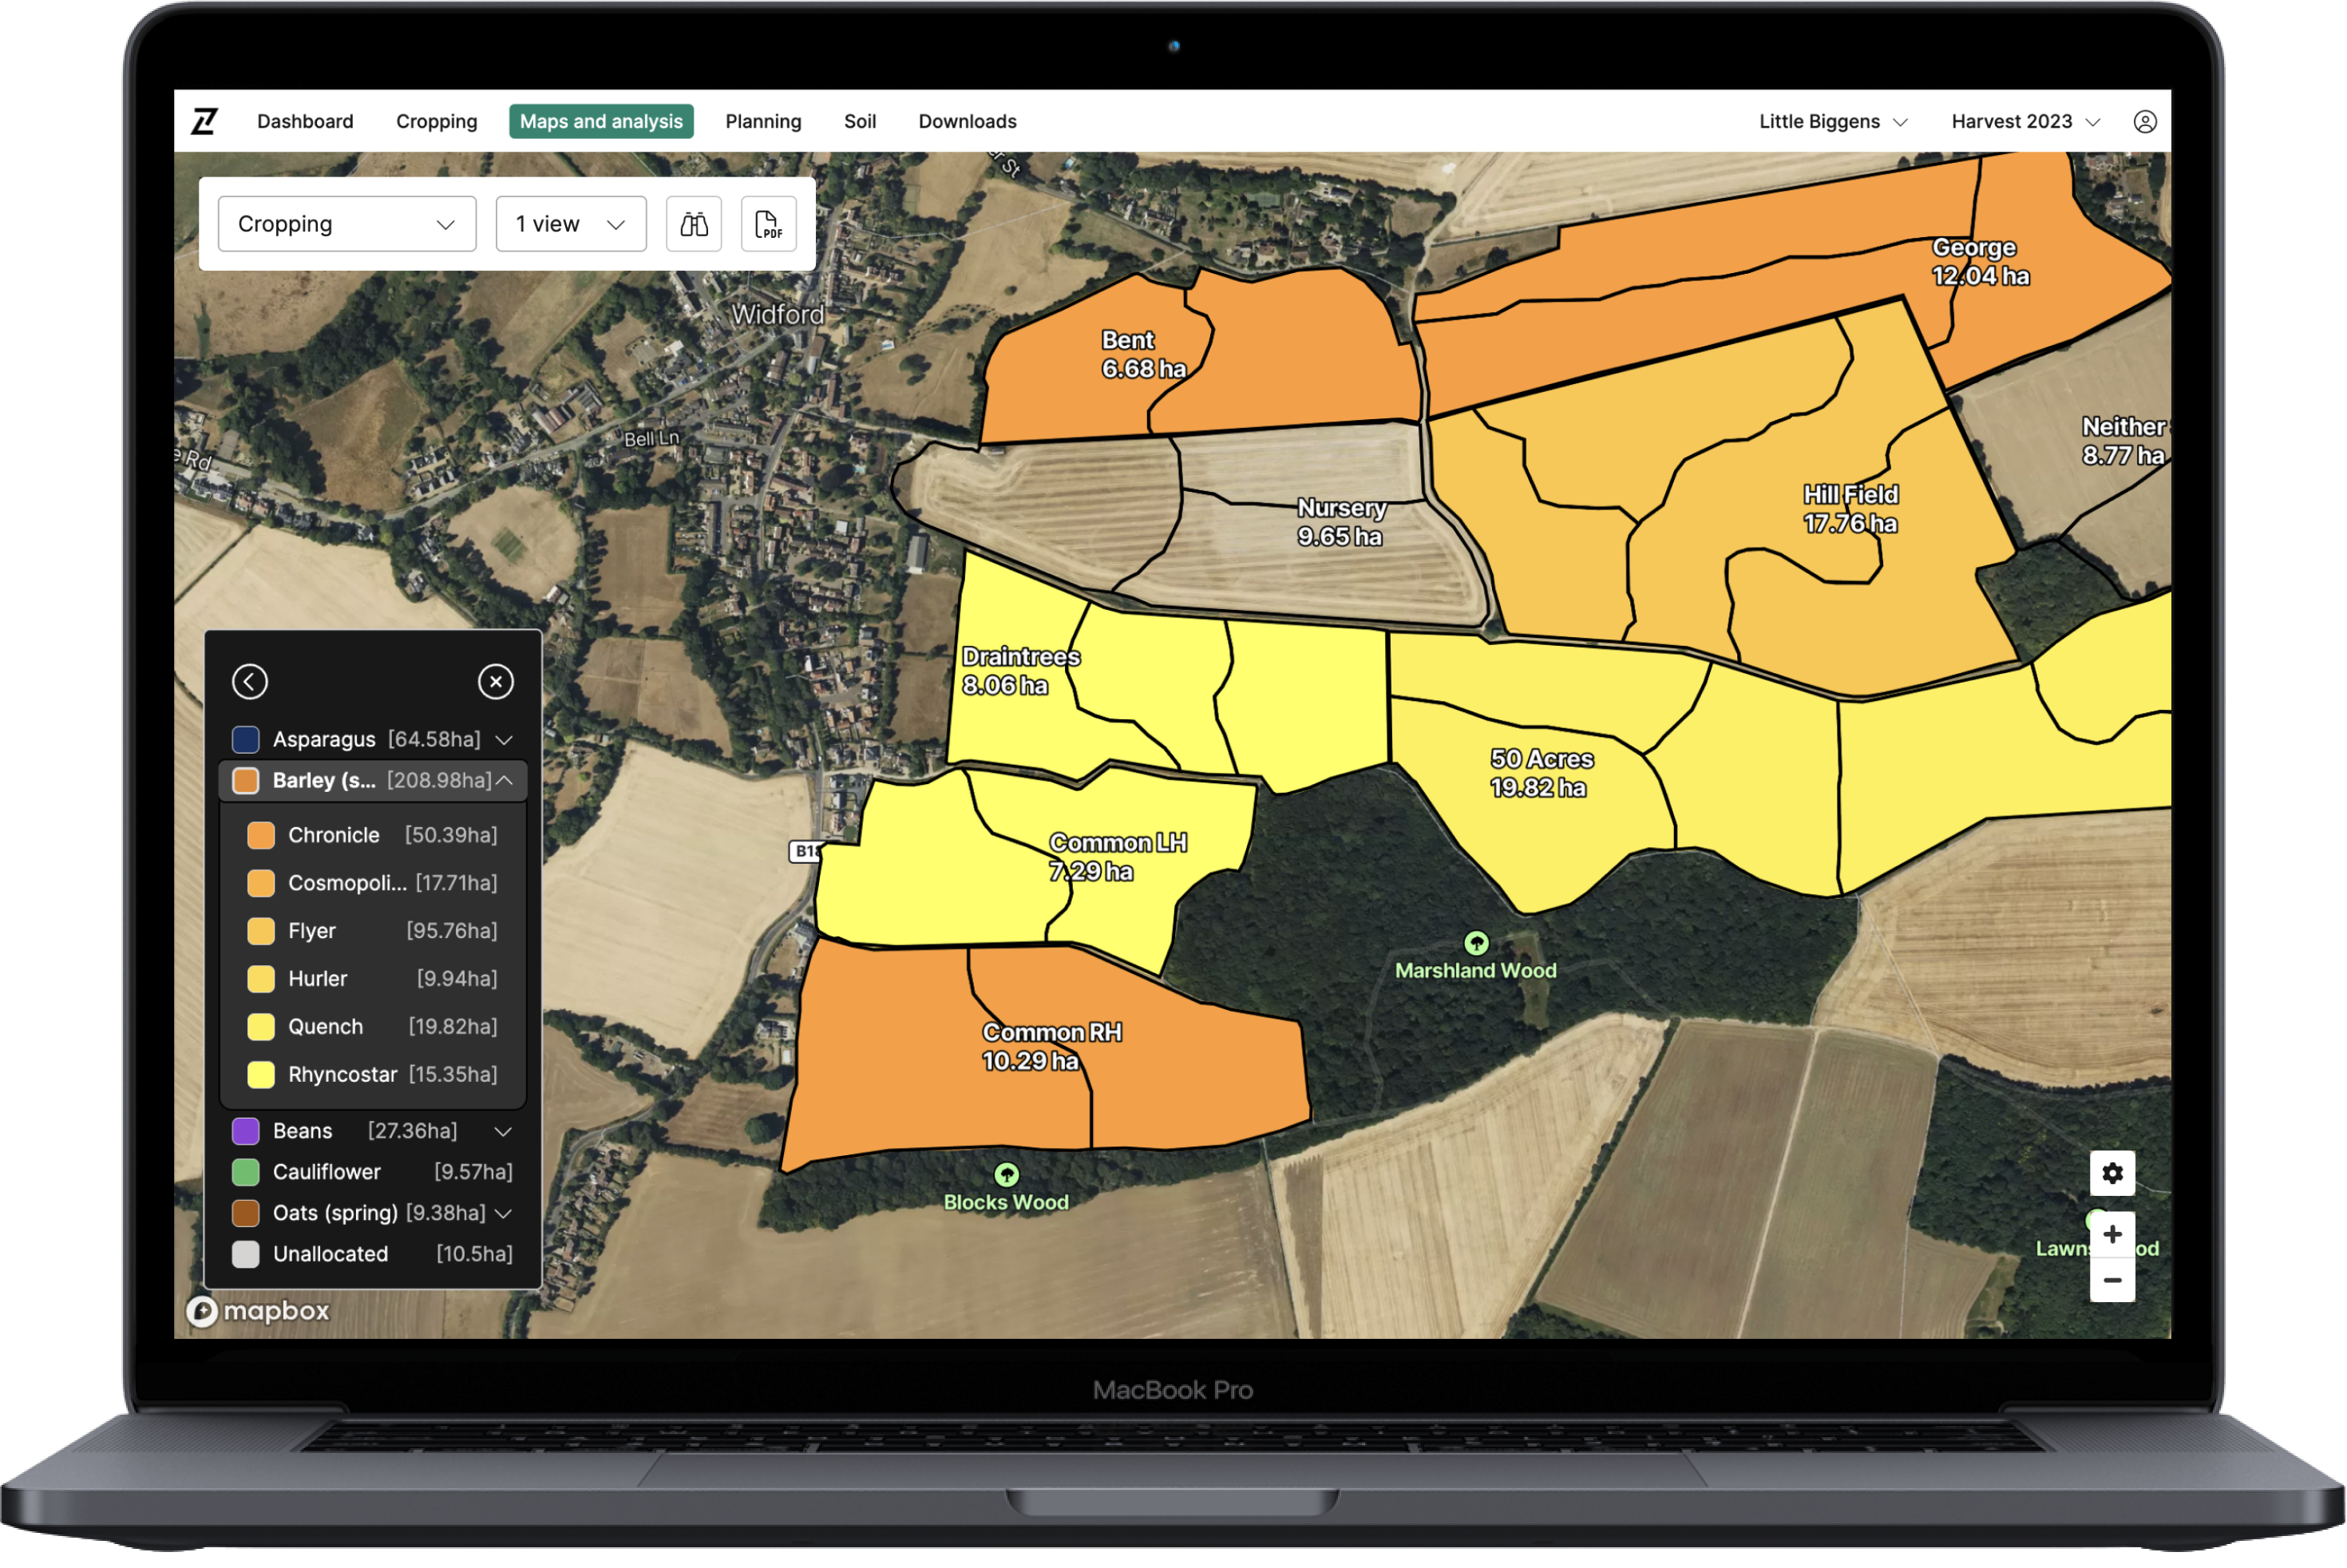
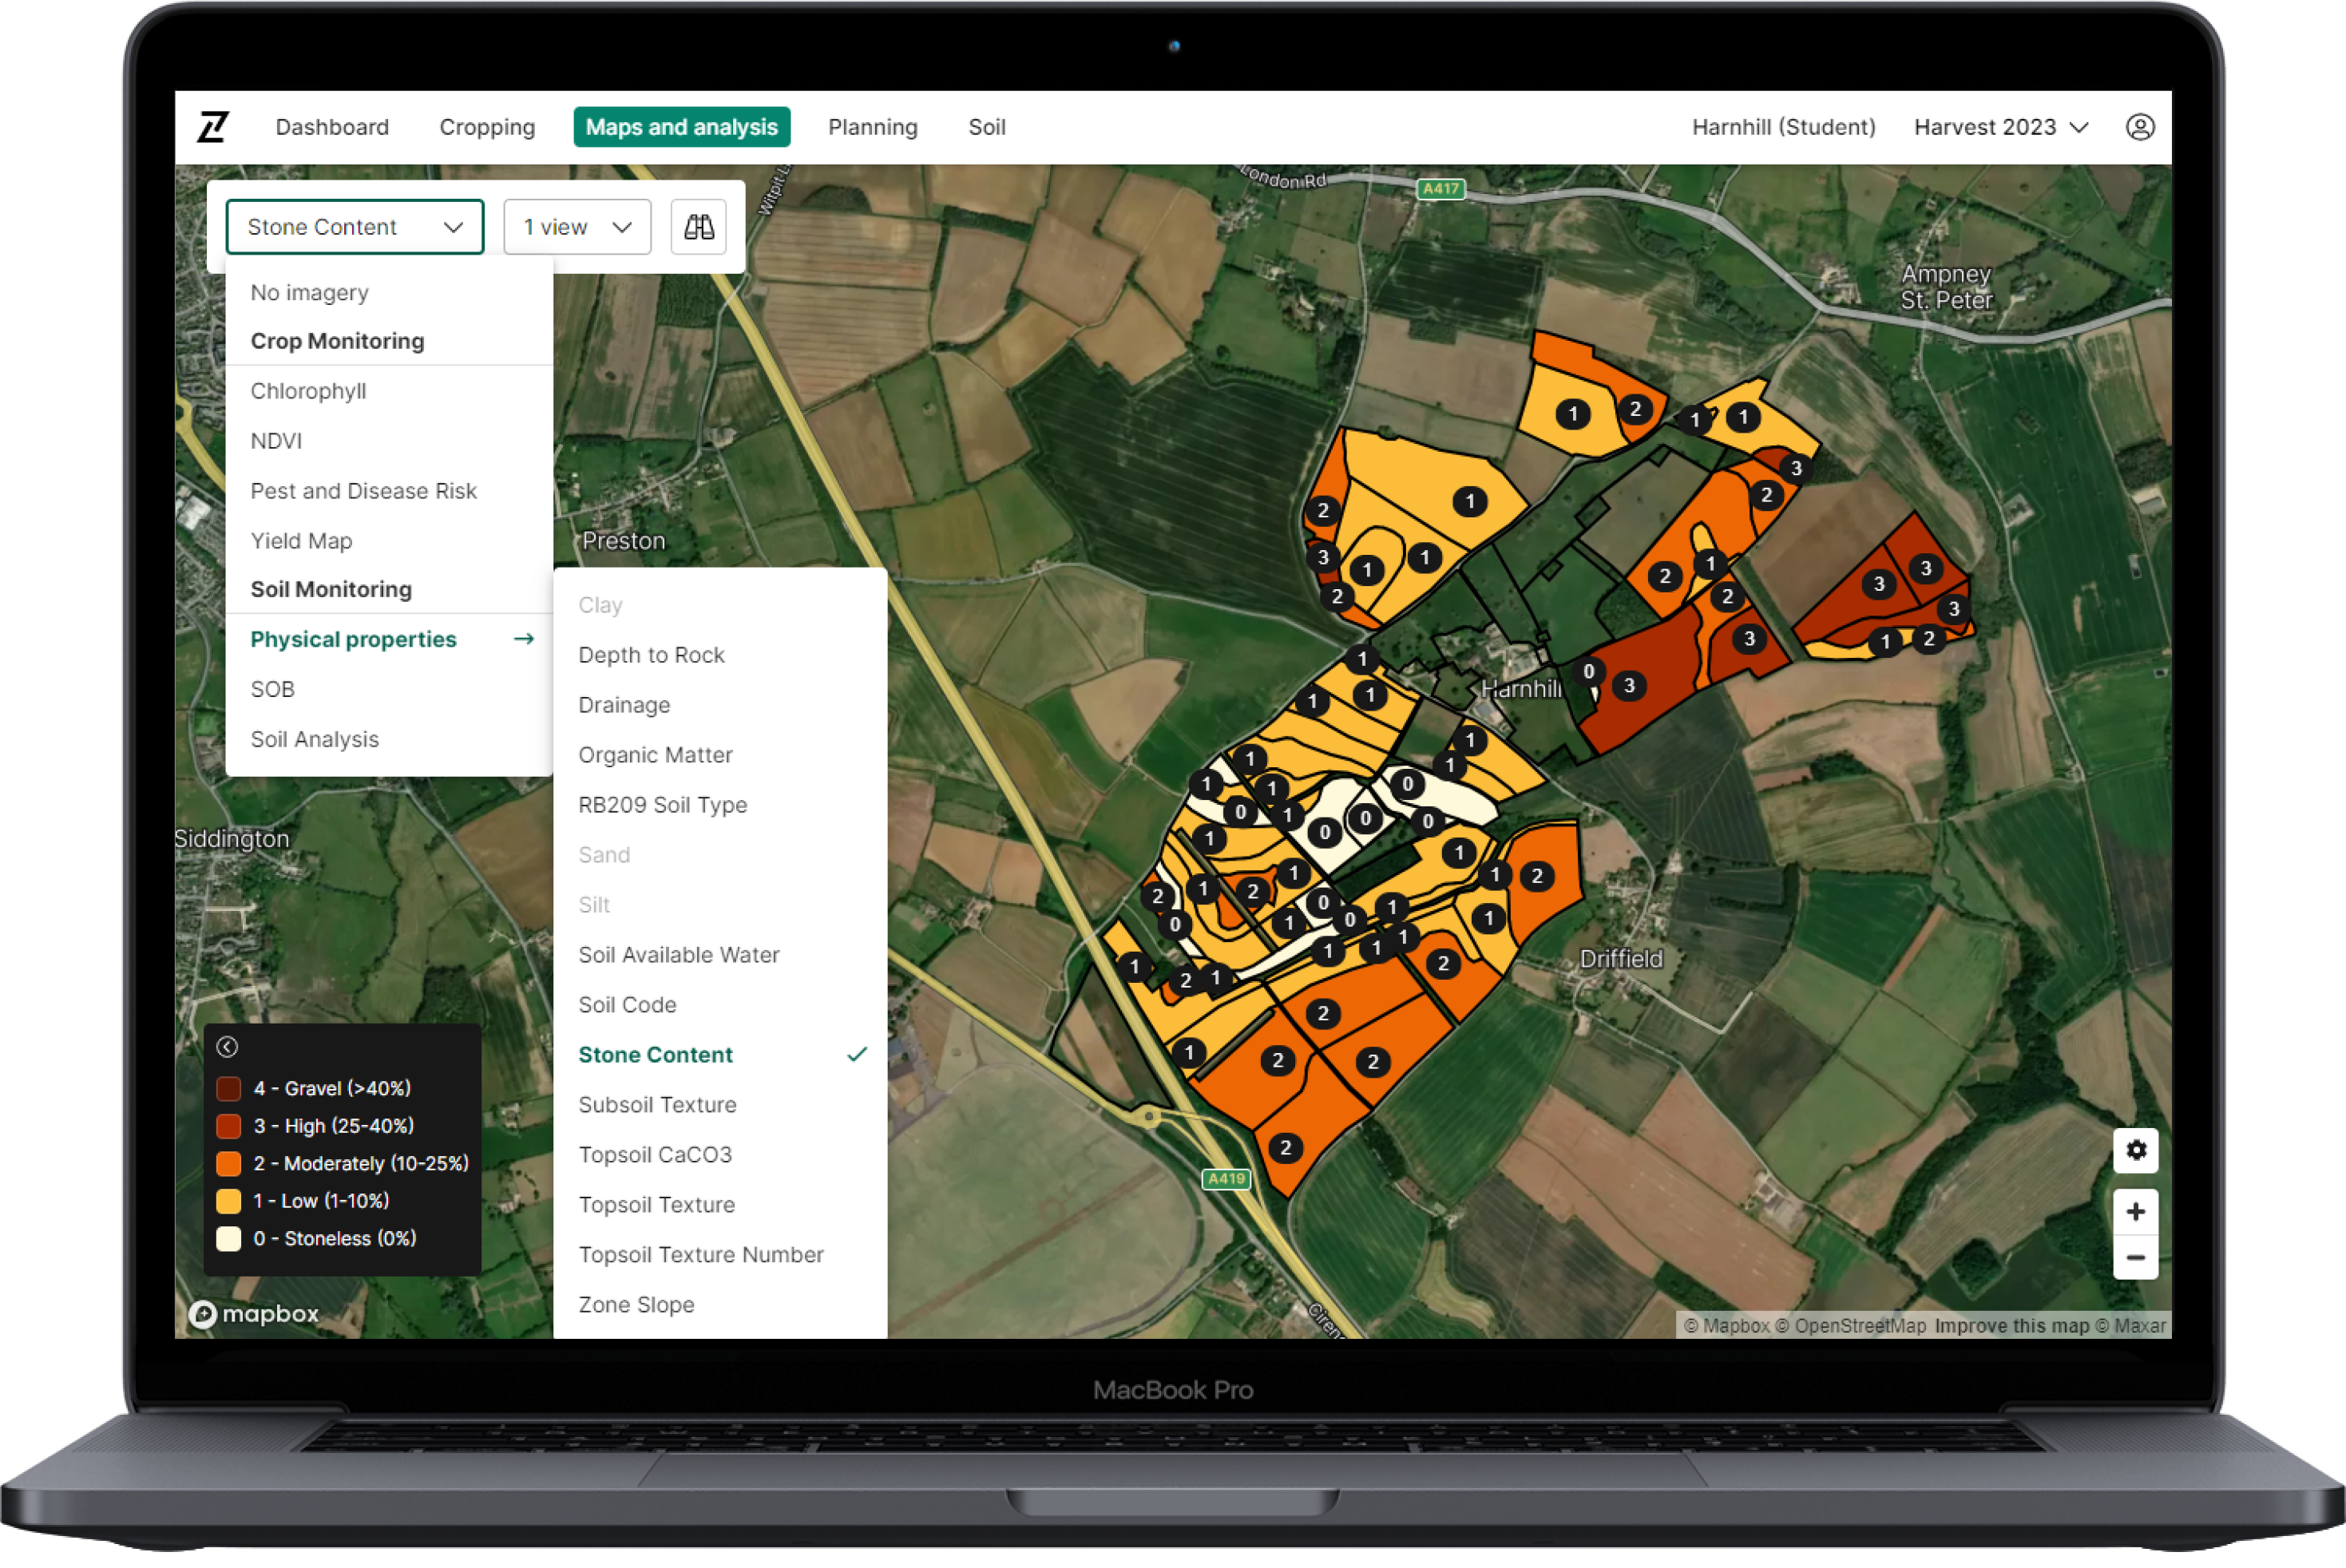
- Users can now view their latest physical property soil sample data in Maps & Analysis alongside all other data layers and imagery types
- All-new legends display the relevant bandings or categories shown for the selected property on the map in each zone. Users can highlight all zones in a particular banding or category by hovering over the relevant legend entry
- This new highlighting feature also applies to the P, K, Mg and pH map layers under ‘Soil Analysis’
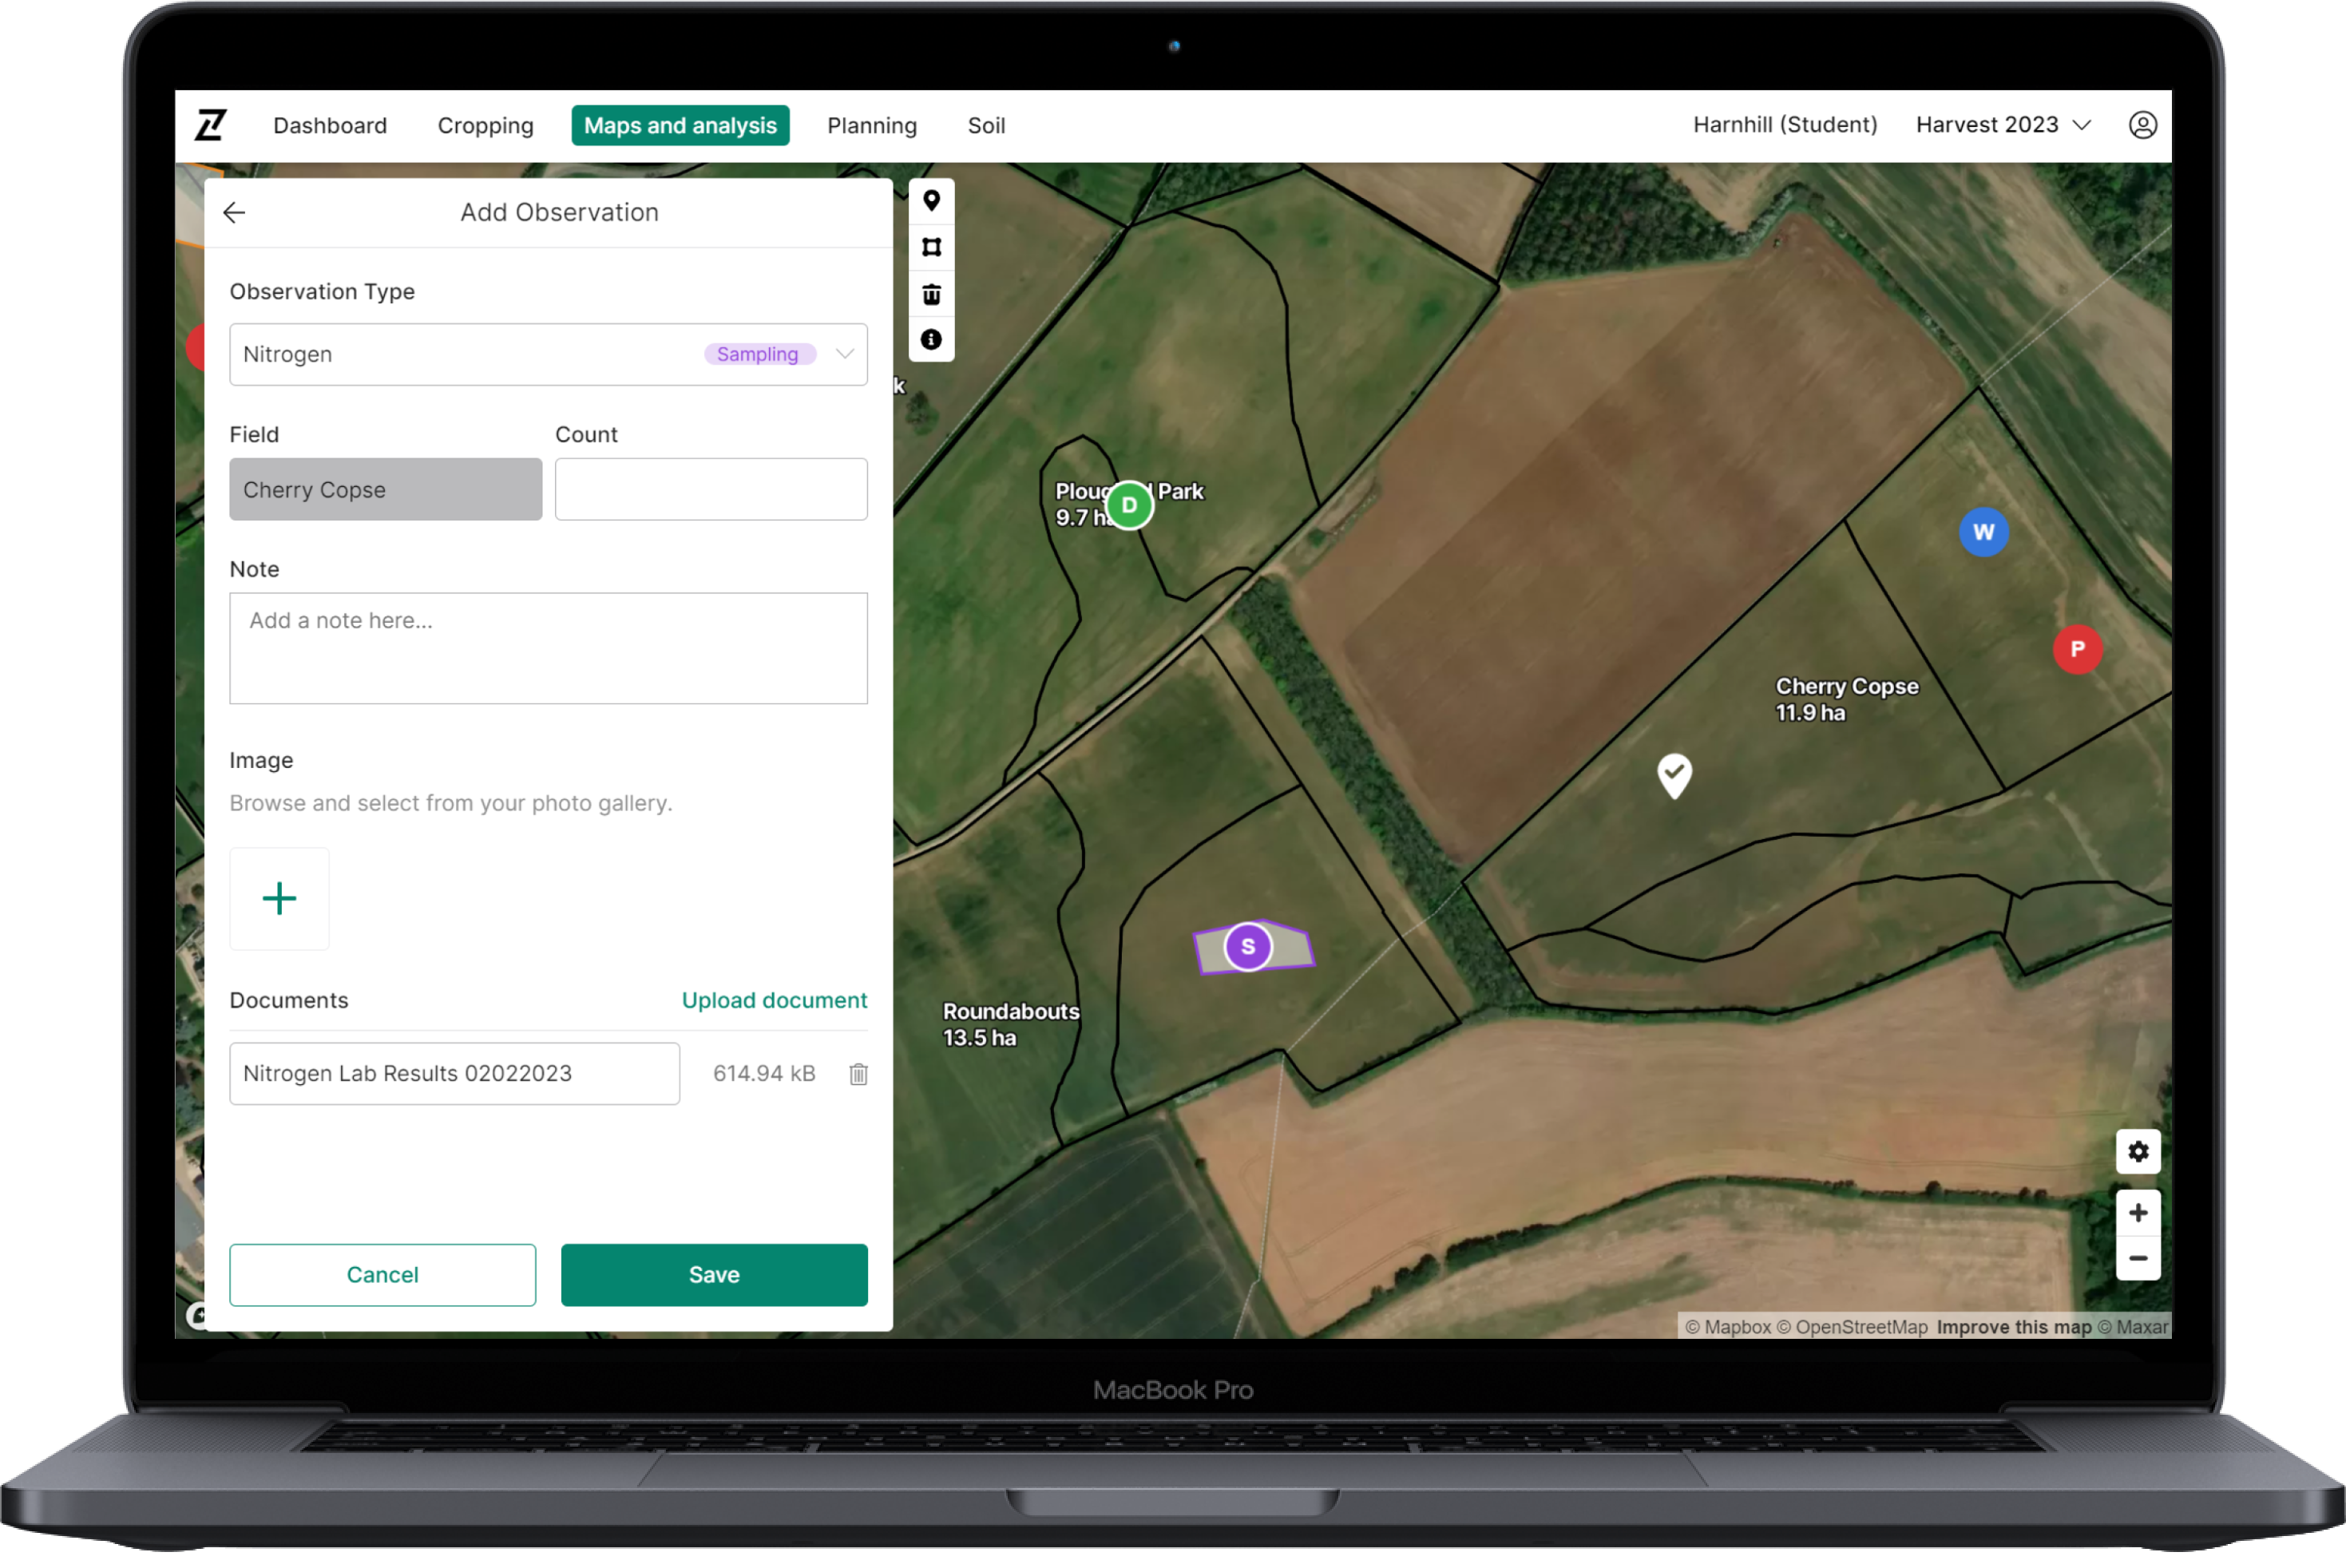
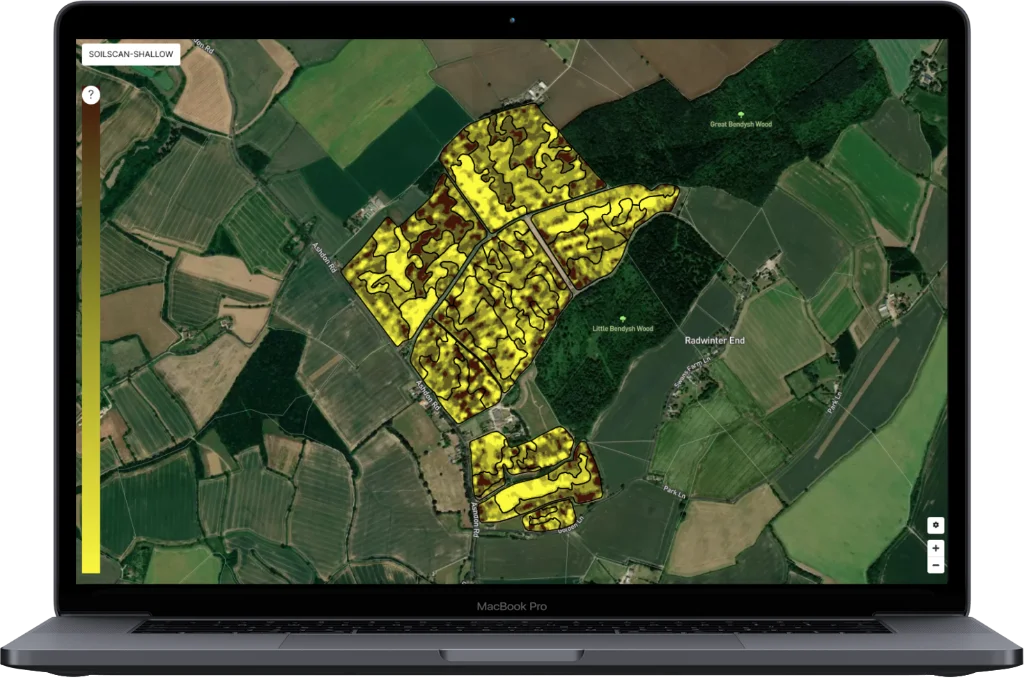
- Soil physical data can be analysed to aid management decisions such as cultivation techniques, travelability and irrigation/infiltration capacities
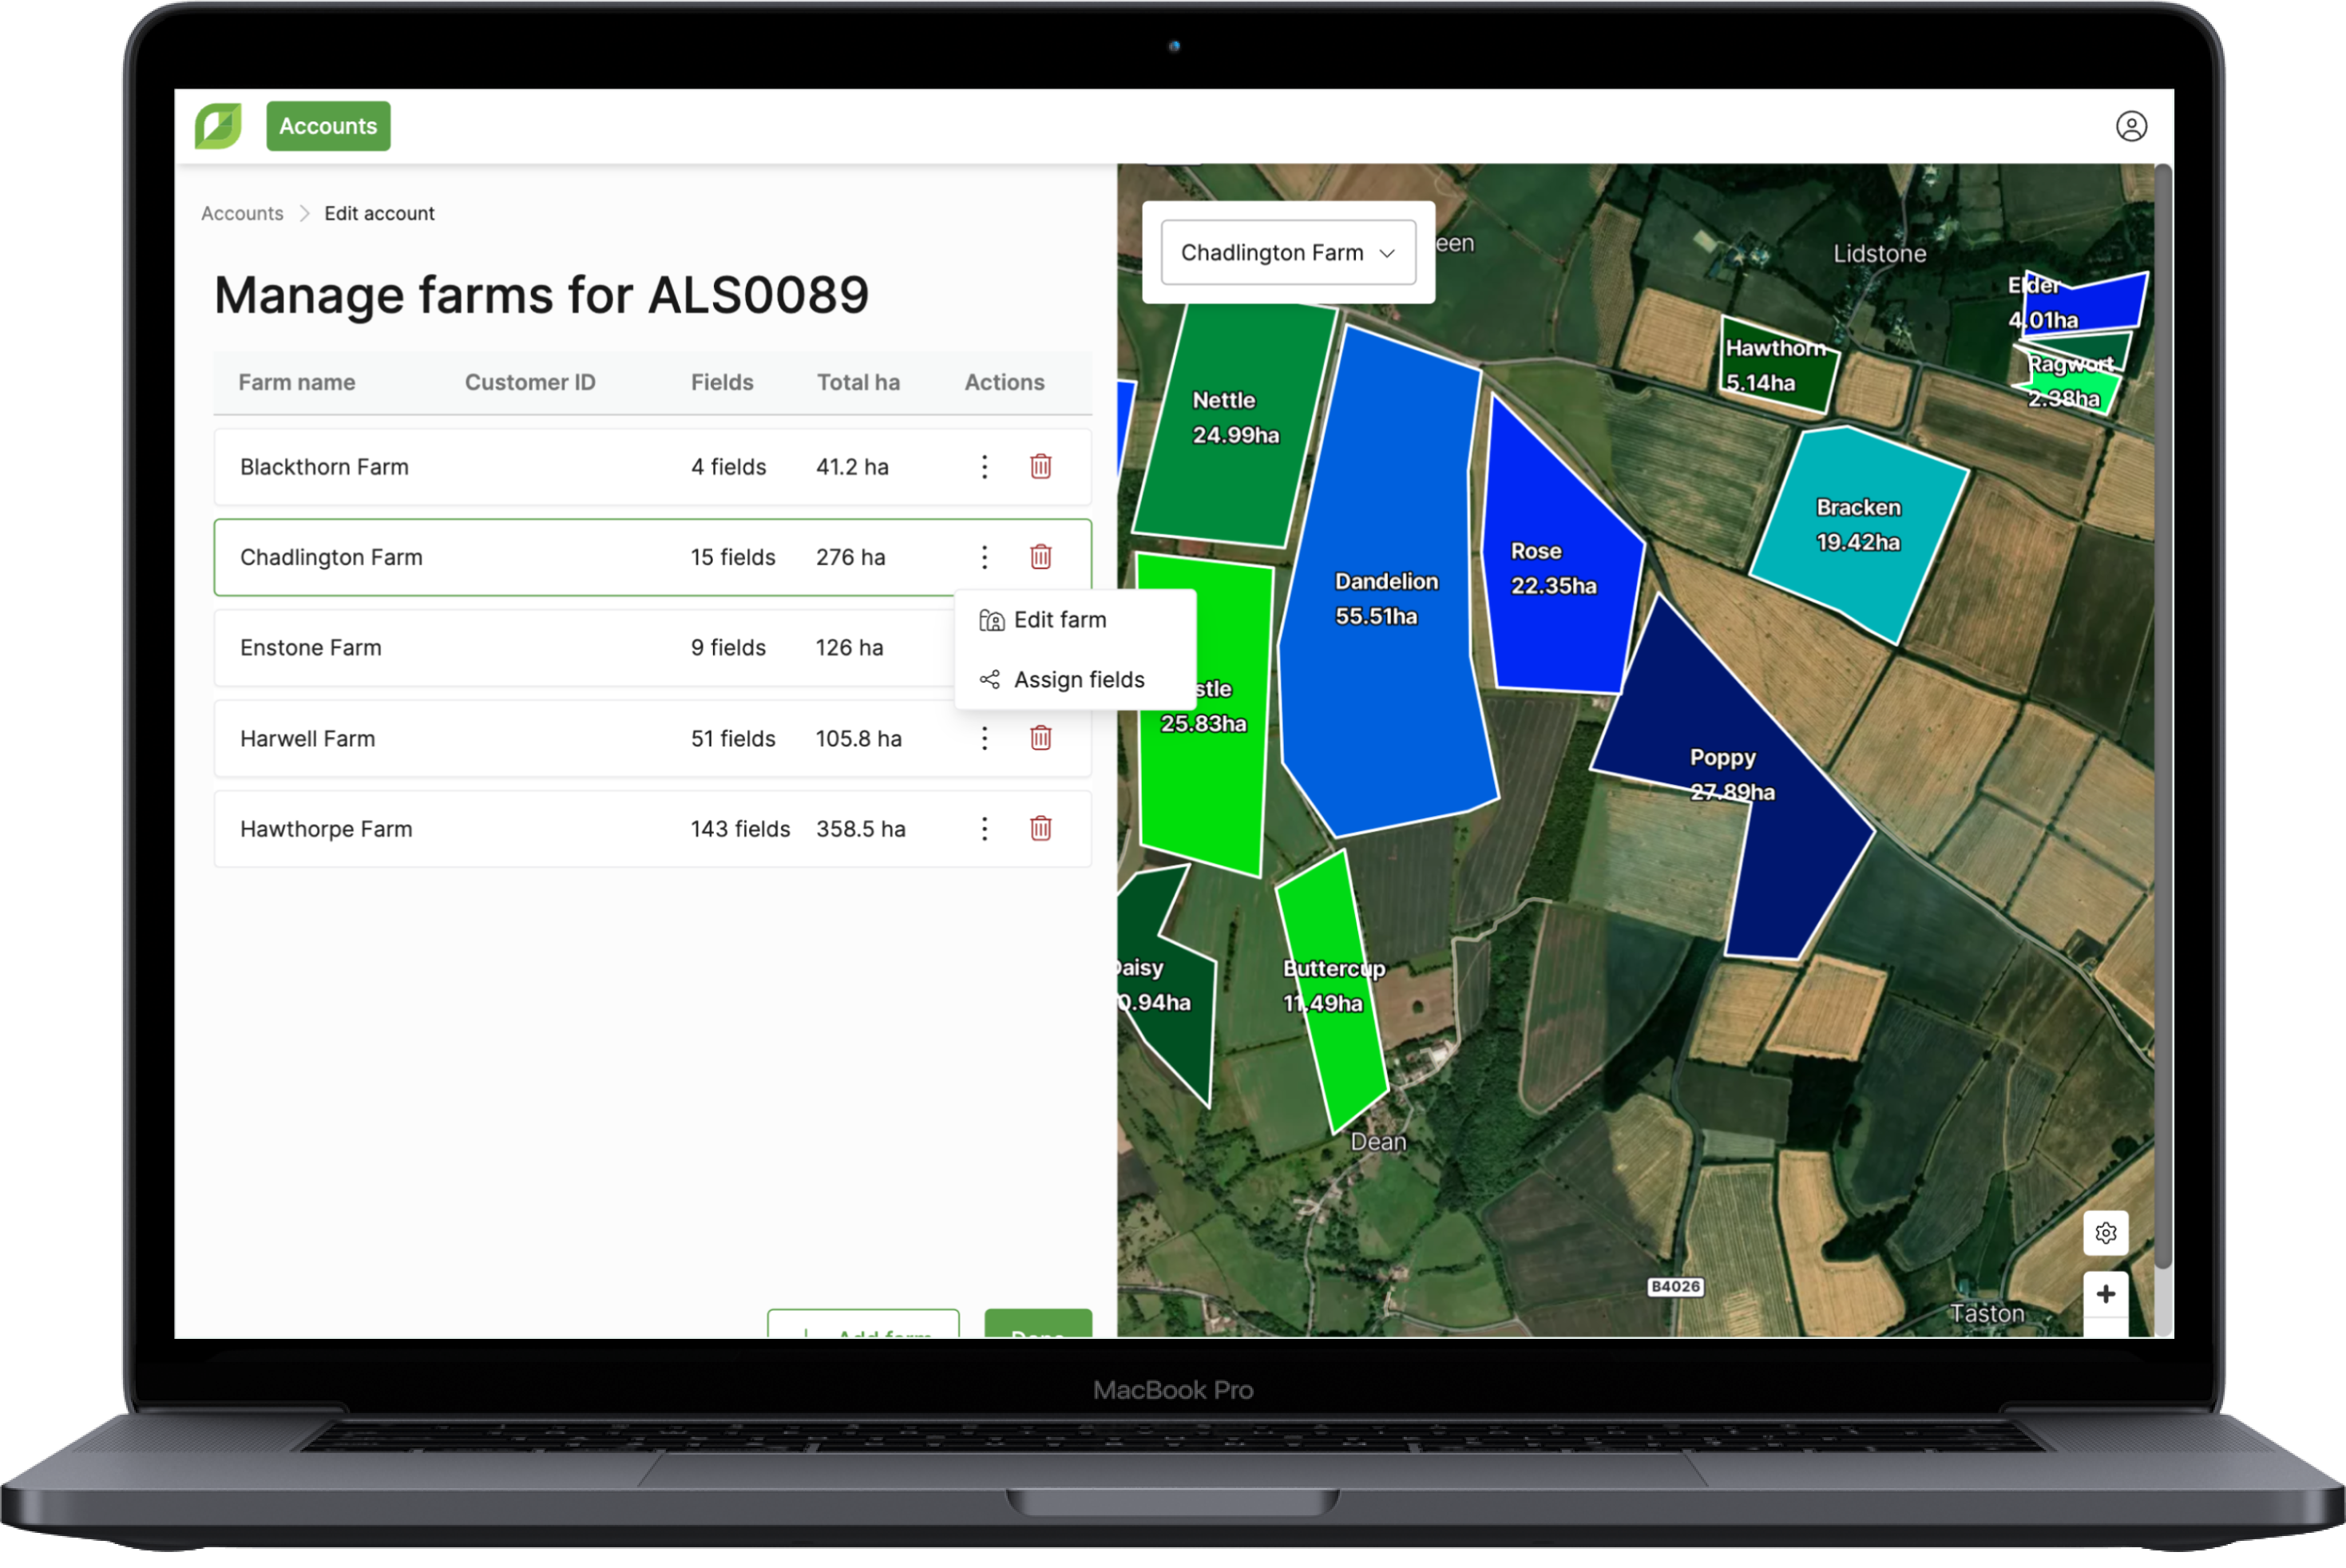
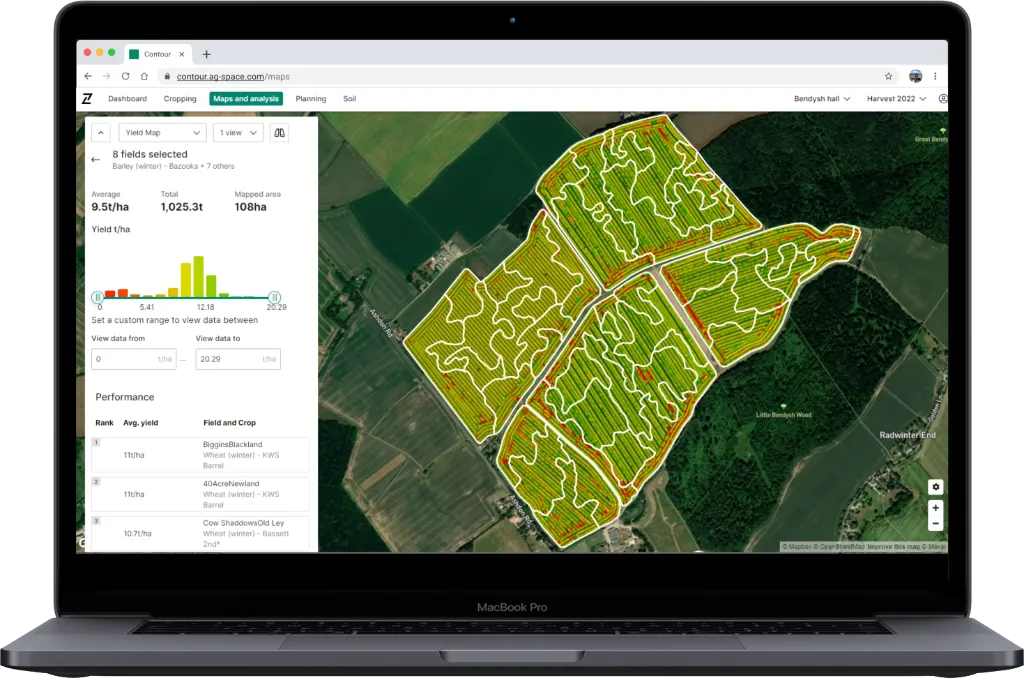
- In addition, users can compare multiple side-by-side views to check soil physical property data against satellite imagery, yield maps and more to help identify cause and effect
Log in to Contour to check out the updates today, and please send any feedback you may have to info@digital.originenterprises.com to help us improve.