Contour Soil properties & Zone labels
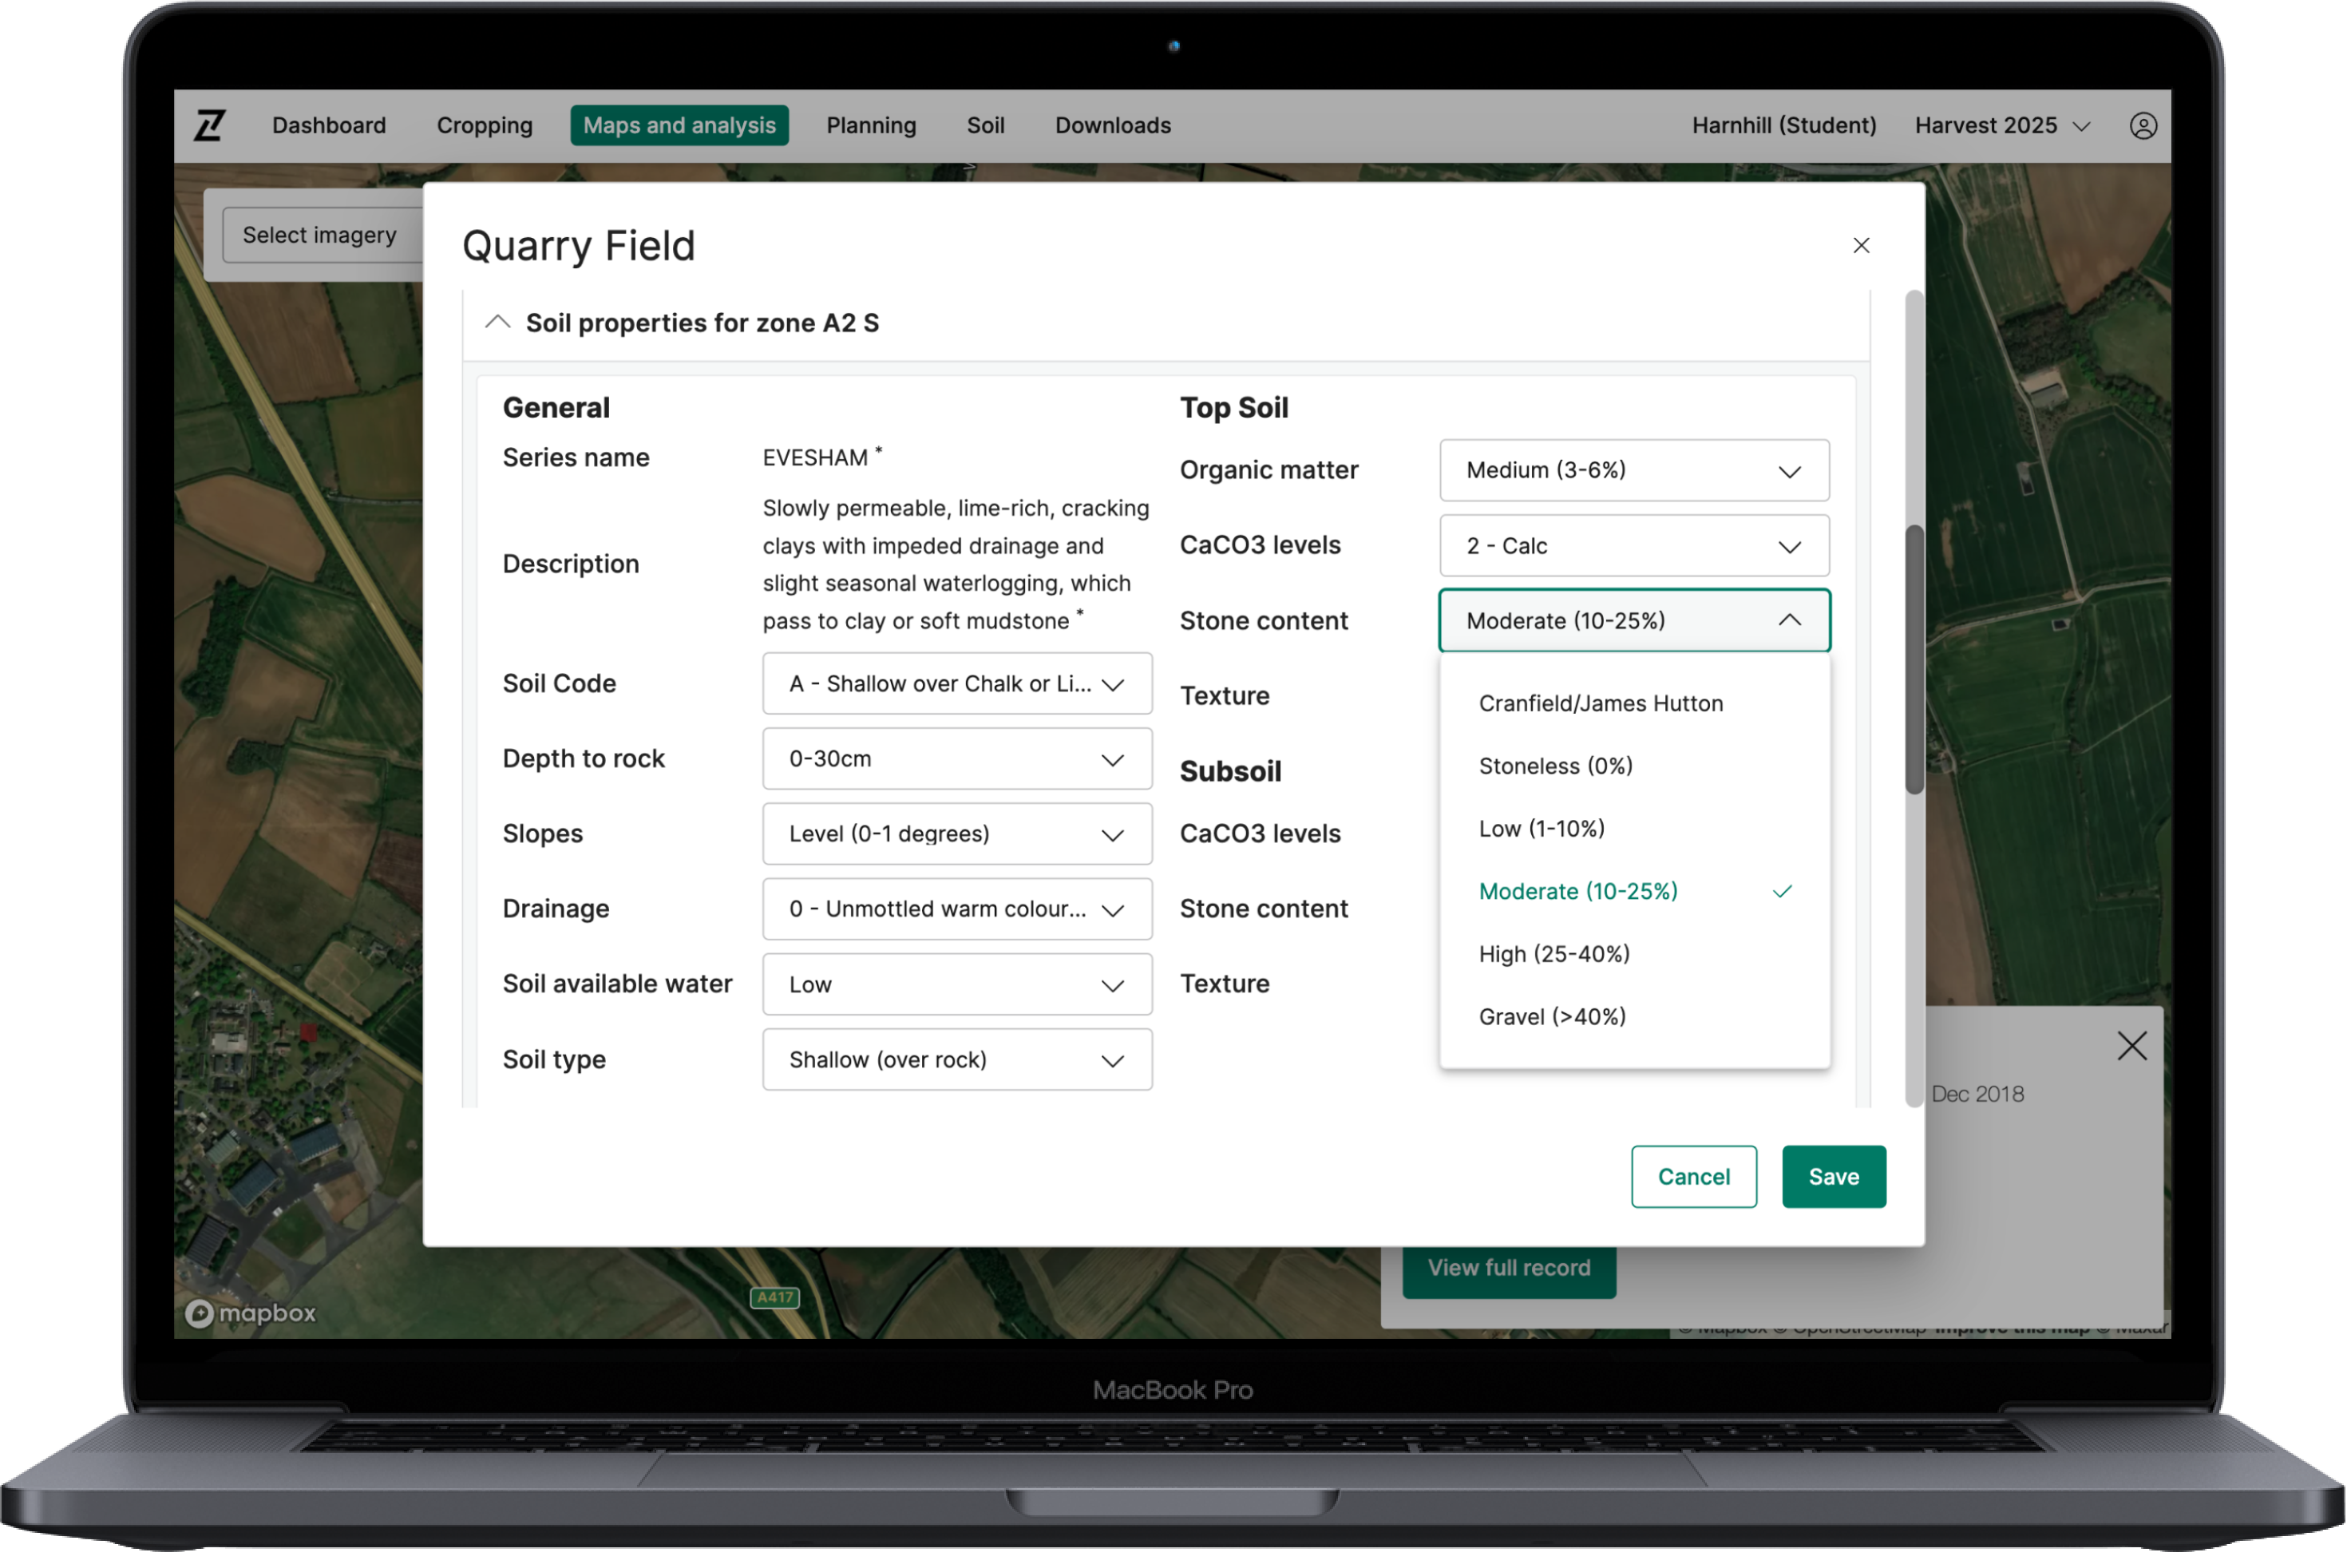
Today’s update to Contour enables users to update the physical soil properties of their fields and zones, helping to more accurately plan inputs by increasing the range of soil data available in zone based seed planning, and improving accuracy of soil types used in nutrient planning and NVZ risk maps.
Here’s how:
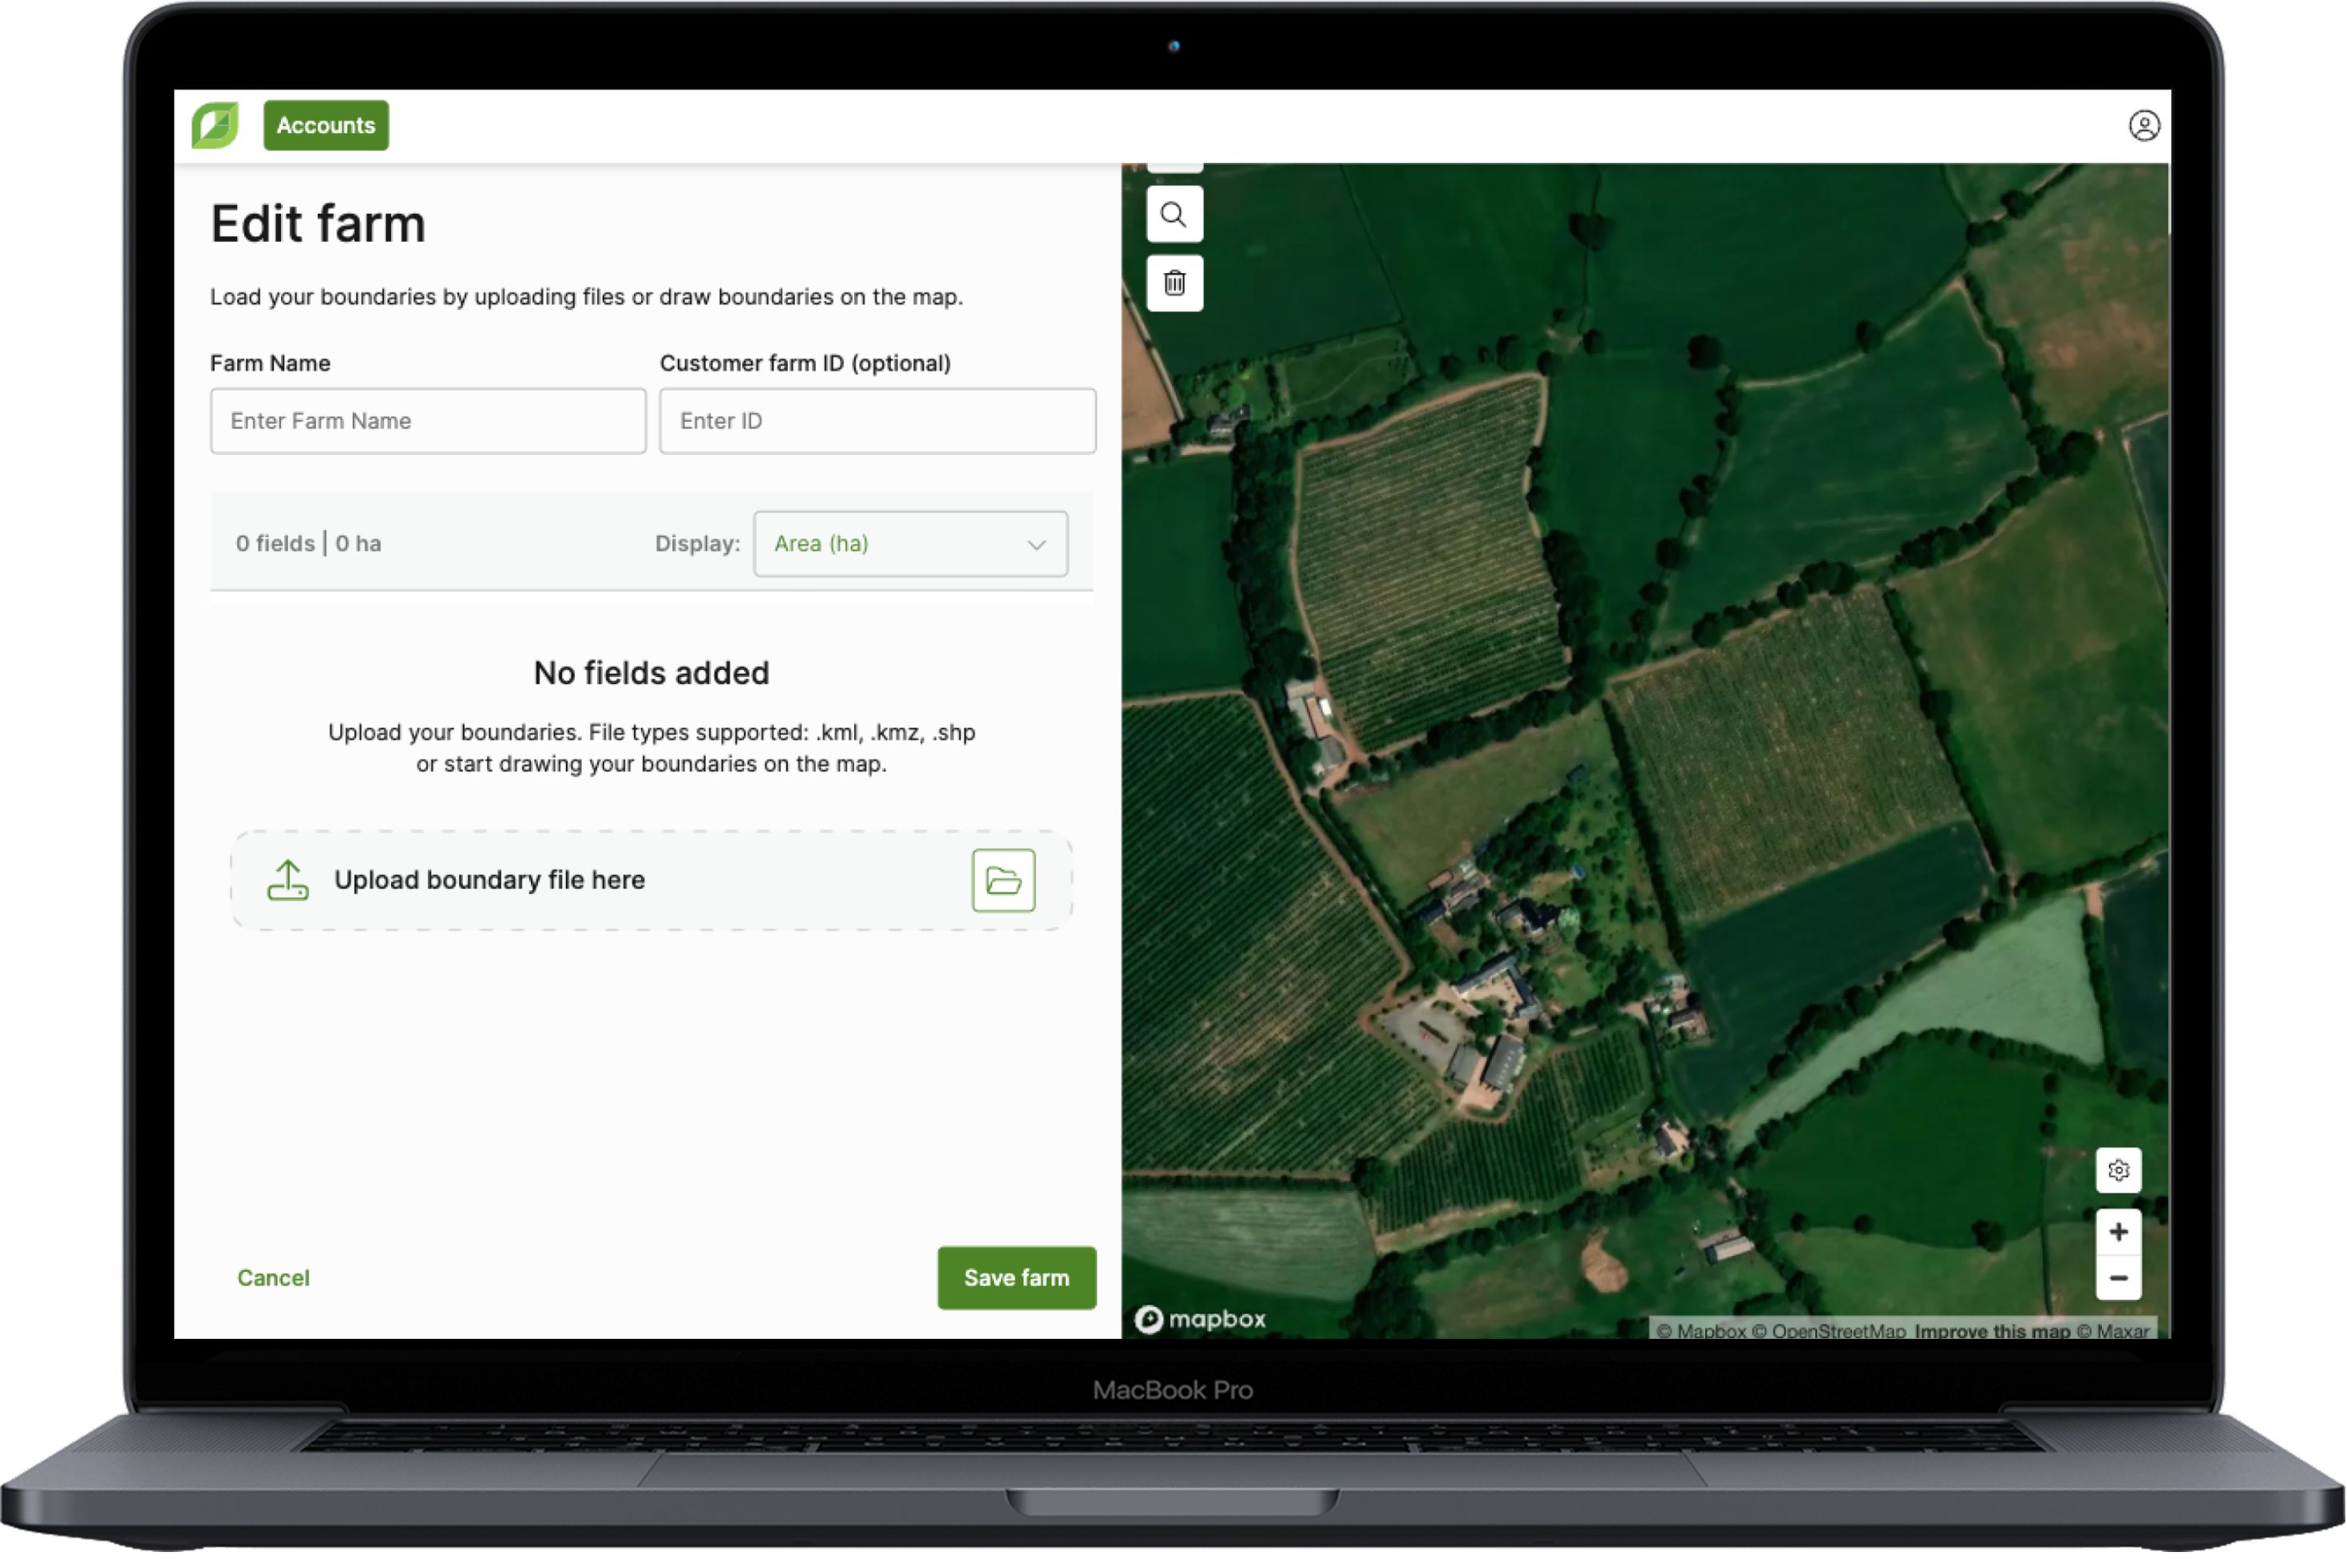
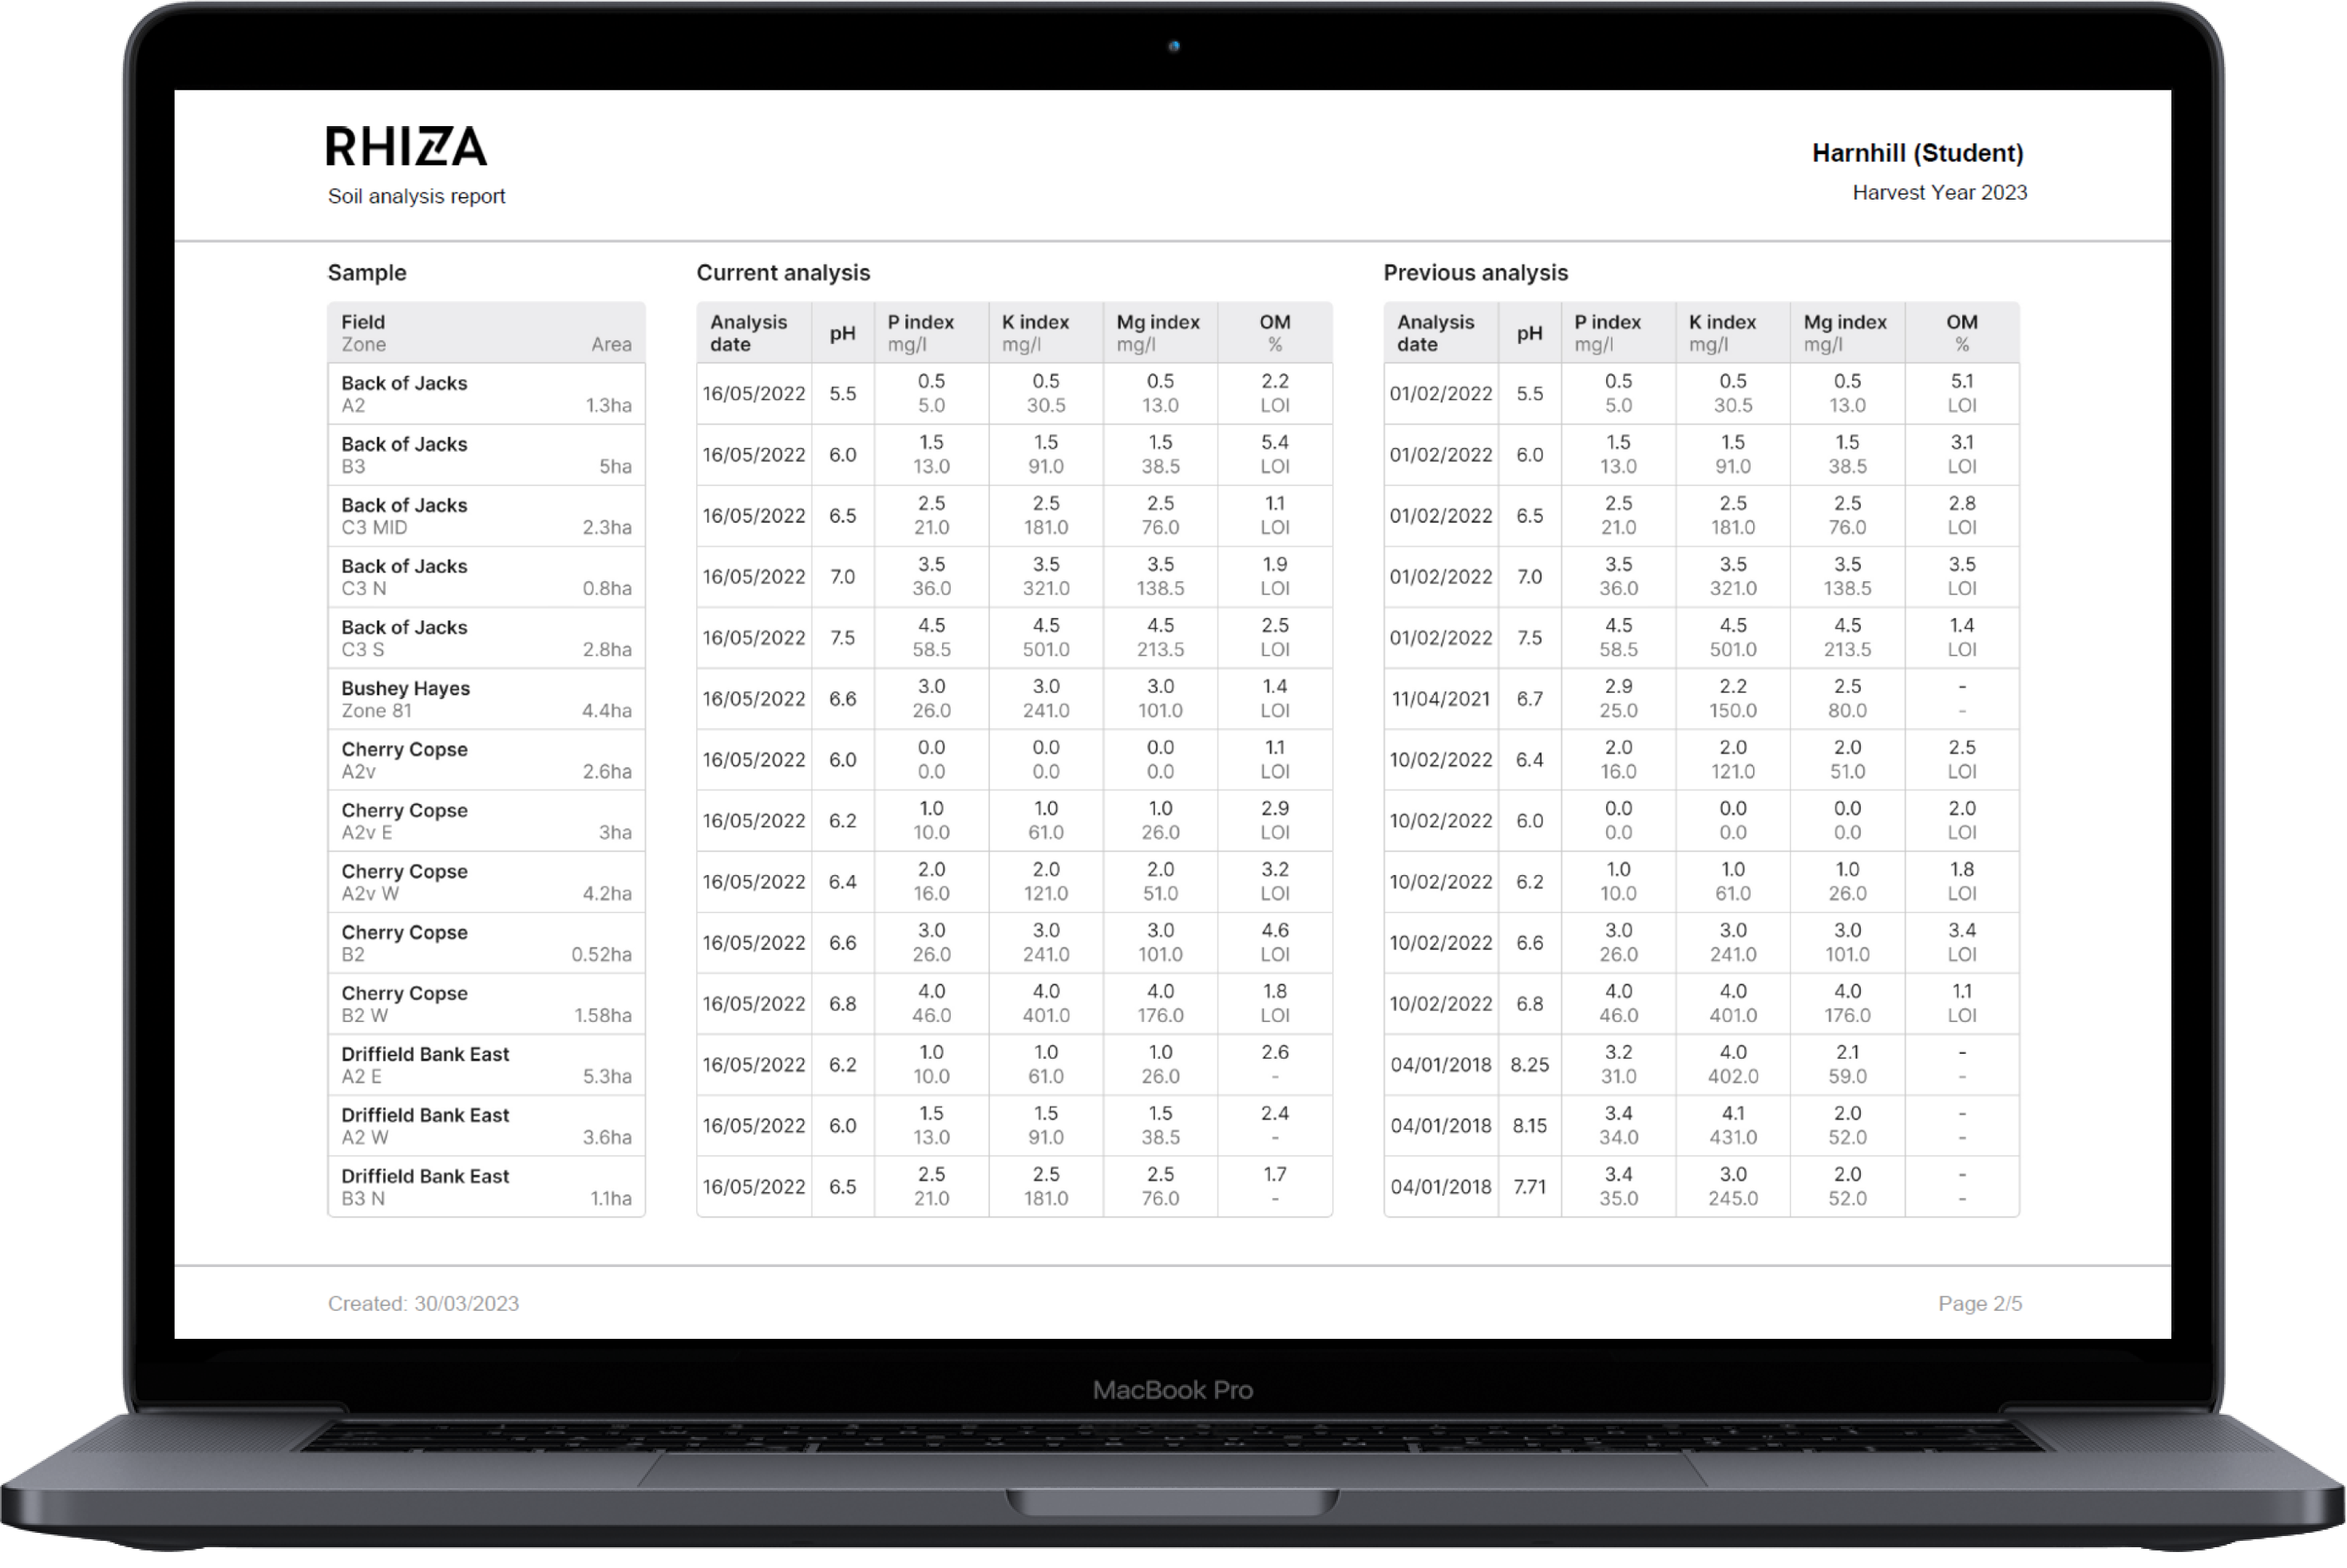
- Physical soil properties can be viewed through the field details pop-up, accessed by selecting the field name in the cropping tab, or by selecting the field in maps and analysis and selecting “View full record”.
- Cranfield or James Hutton data are displayed by default and marked by an asterisk* if no data has been entered previously. The accuracy of Cranfield and James Hutton data varies by region, and therefore you may wish to update this information.
- Soil properties can be updated by selecting the edit button, selecting the required option from the dropdown menu, and then pressing save. Multiple properties and zones can be updated at once to save time.
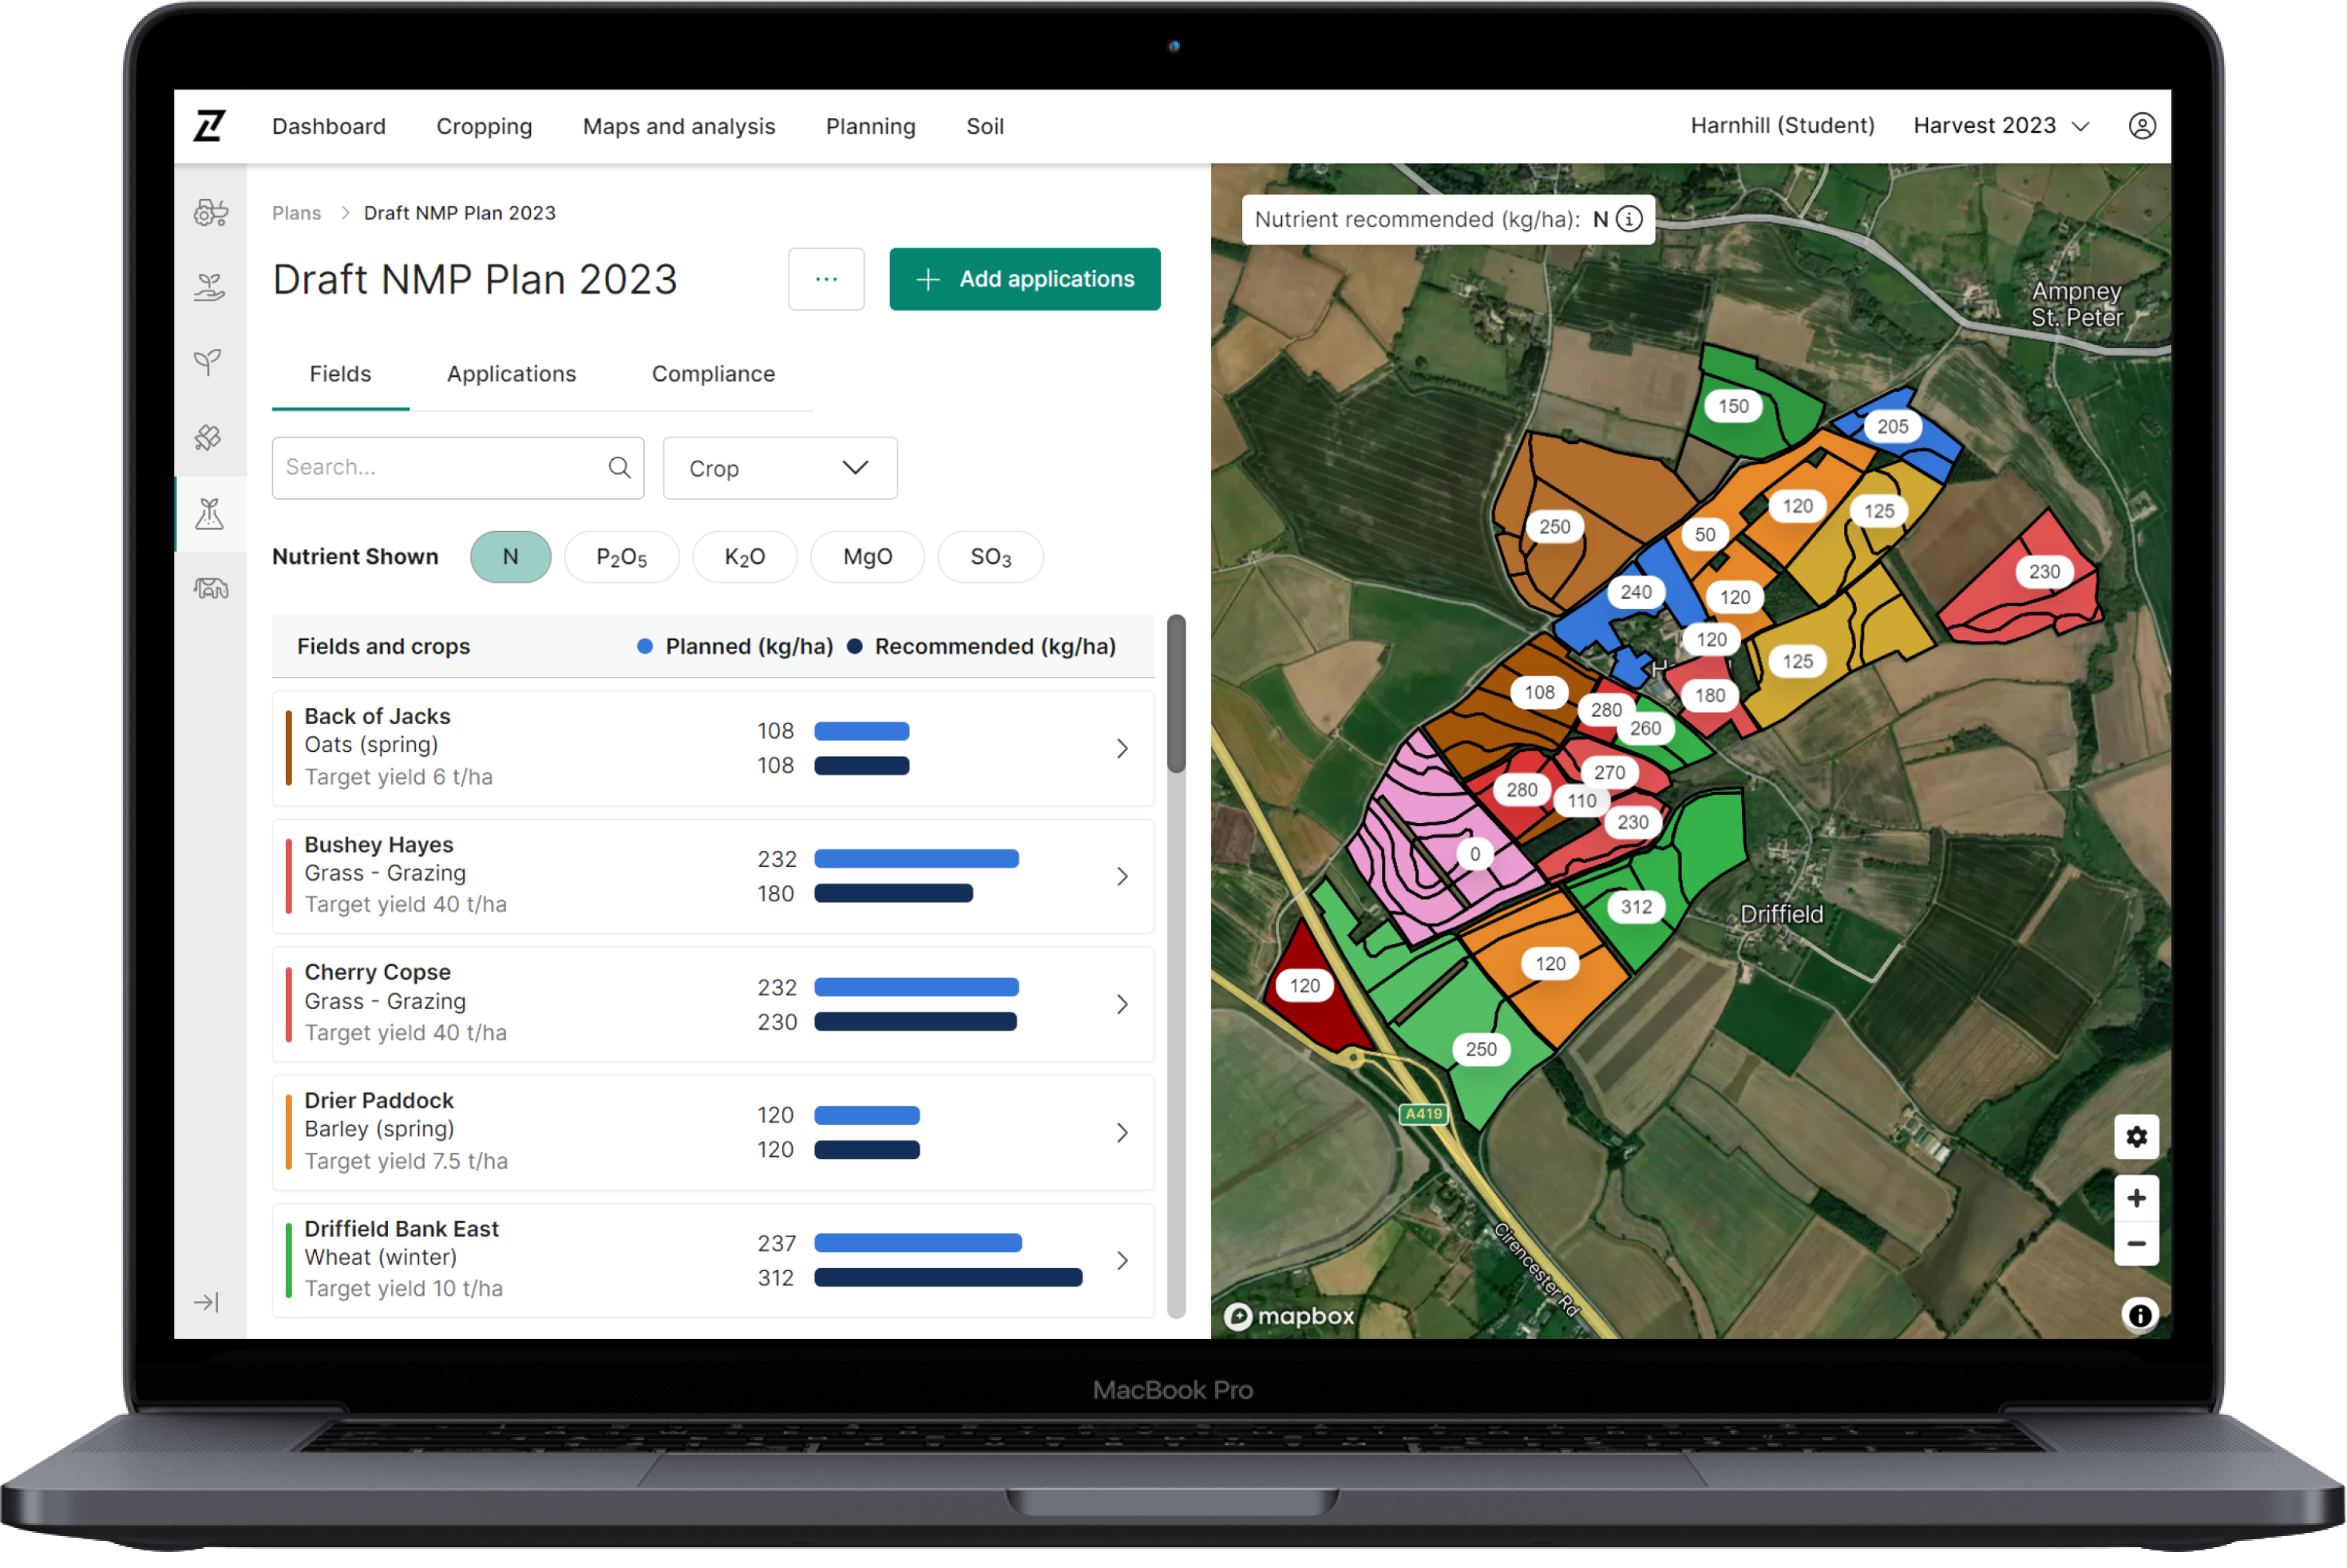
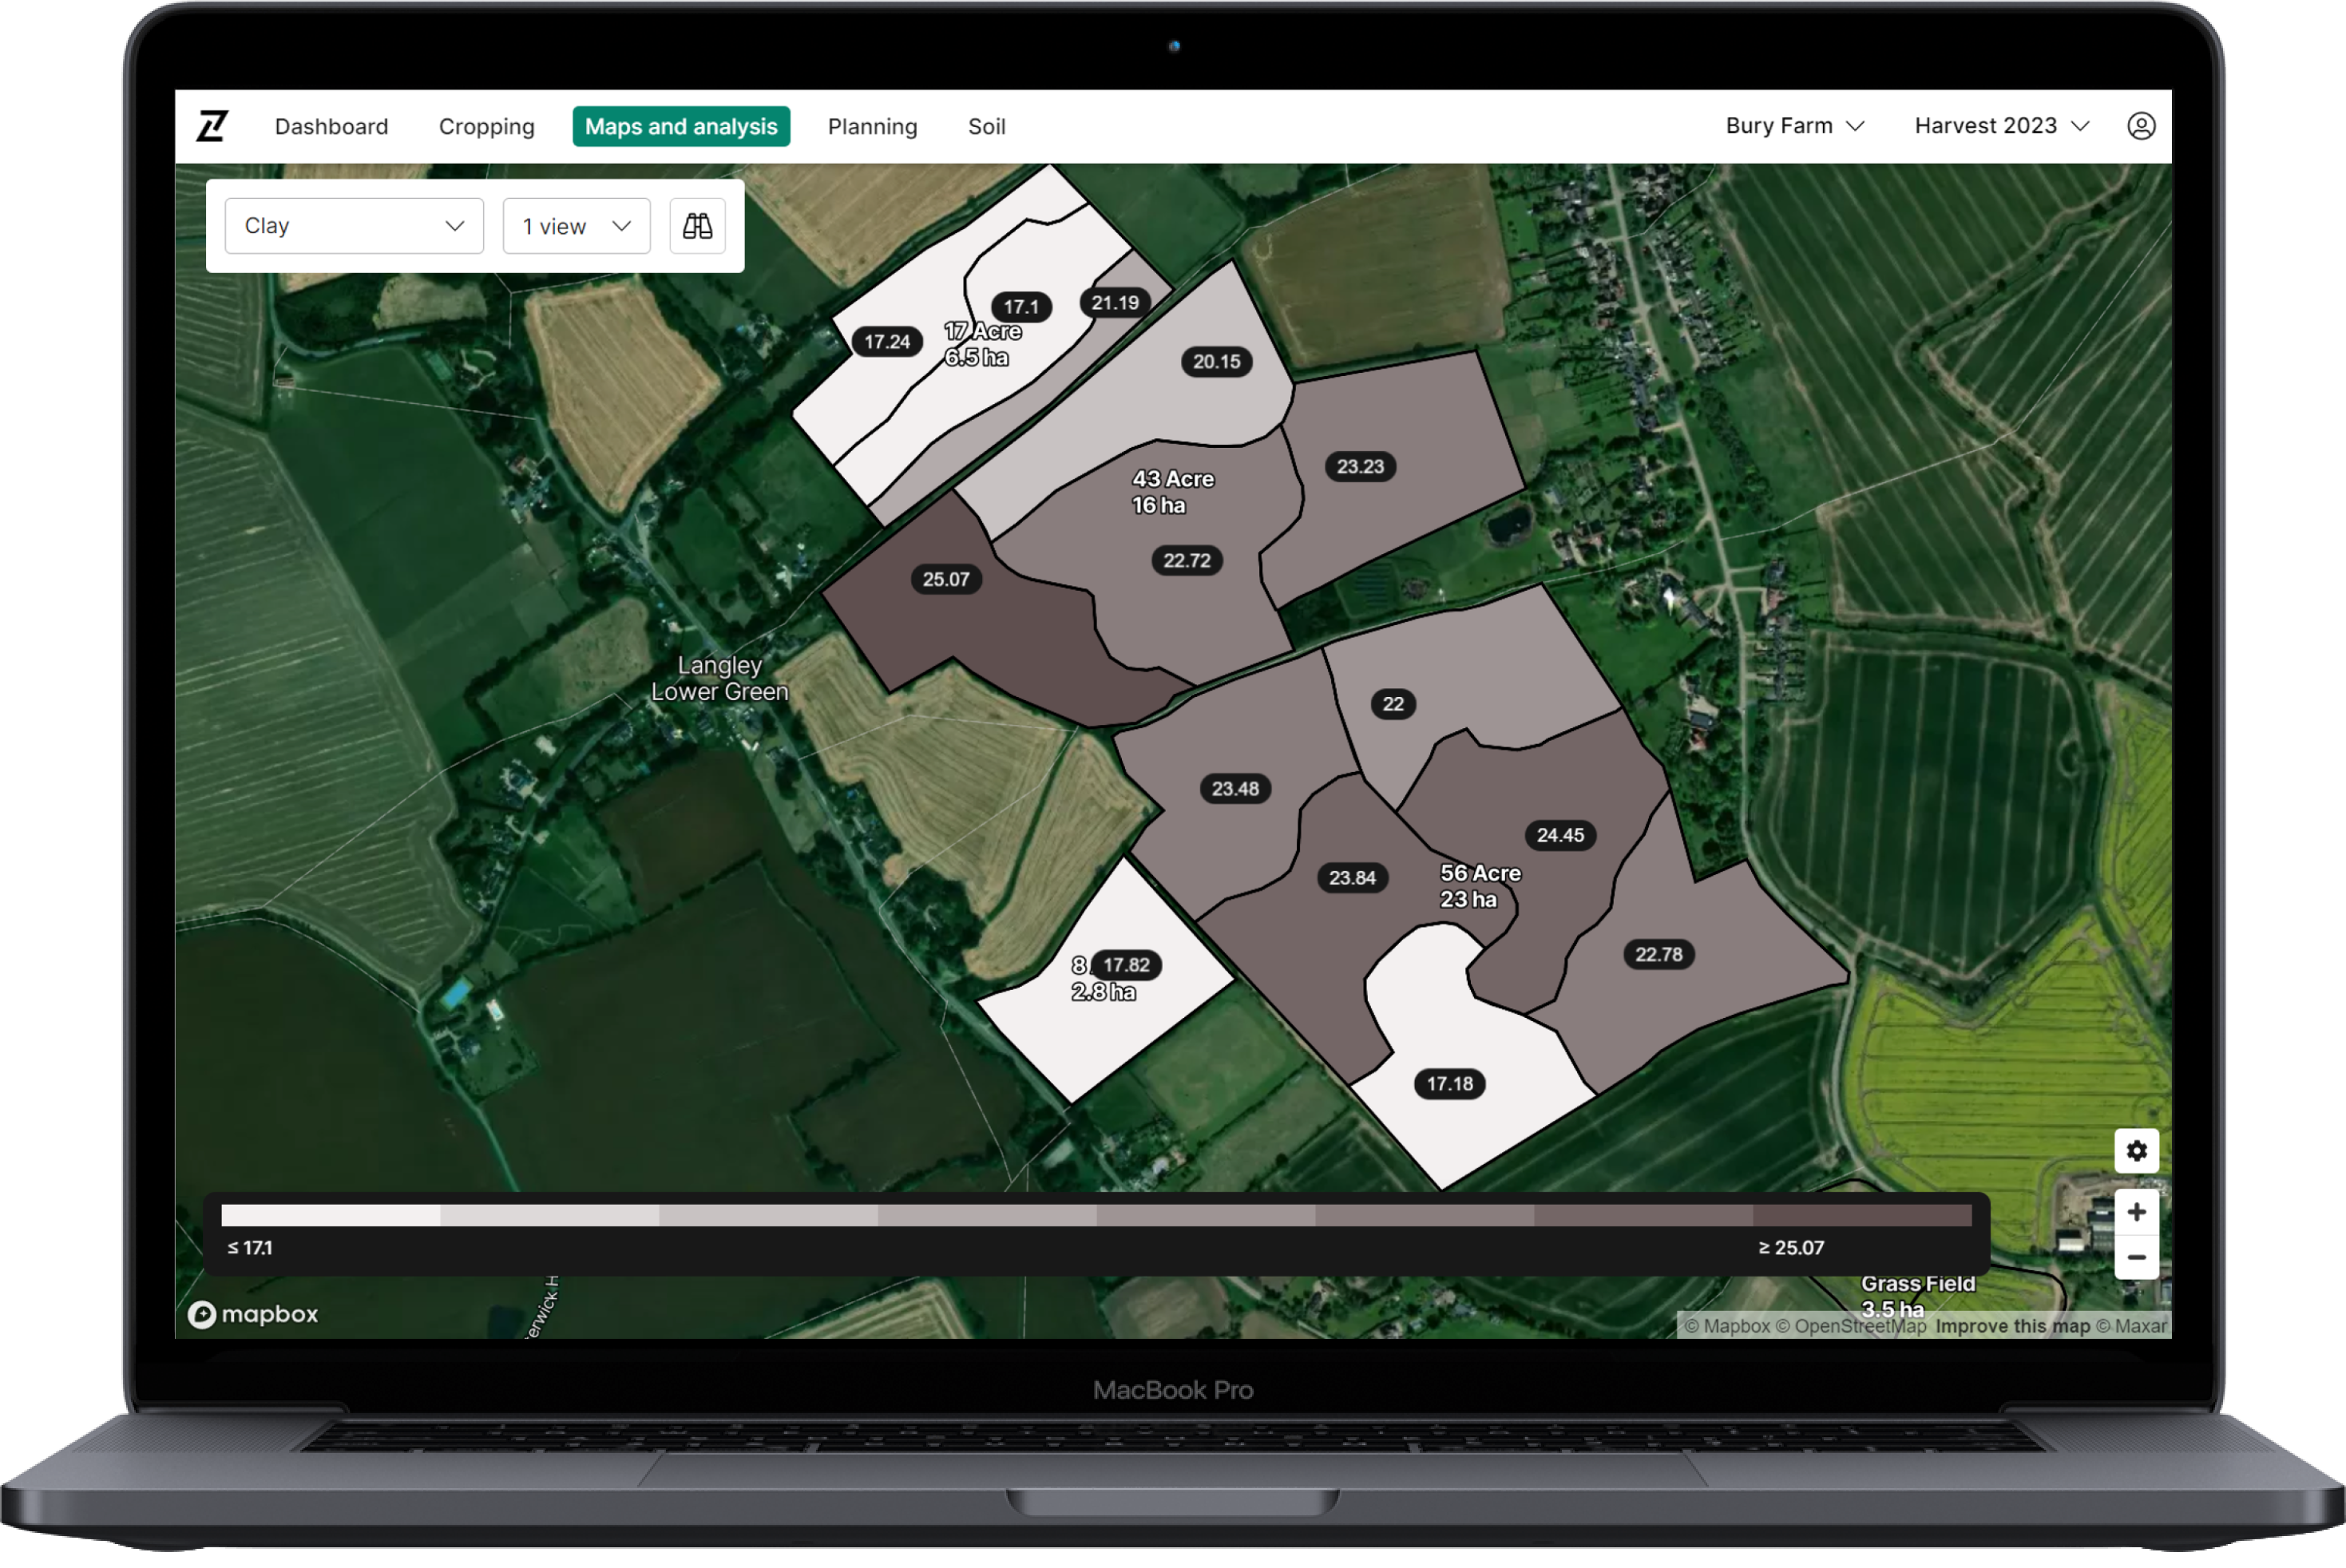
This release also includes an update to Maps and Analysis on Web and Mobile that enables you to view or hide zone boundaries and zone labels in the map. This enables zone labels to be viewed in the new mobile app for the first time, removing reliance on the old Contour app.
Here’s how:
- The zone boundary and zone label toggles can both be found under the map settings cog in the map page.
- Boundaries and labels can be viewed at the same time as any layer, but where a layer is chosen that shows data labels for each zone on the map (e.g. P Index), the zone label will be shown instead of the data label for that layer (see second image).
- To view the data label, simply turn zone labels off.

Log in to Contour to check out the updates today, and please send any feedback you may have to info@digital.originenterprises.com to help us keep improving.