Visualise Clay, Sand & Silt Data in Contour
Today’s second update to Contour introduces a new way to visualise clay, sand and silt soil data, allowing users to make detailed comparisons to understand how soil characteristics are impacting biomass or crop health so that appropriate management practices can be implemented.
Here’s how:
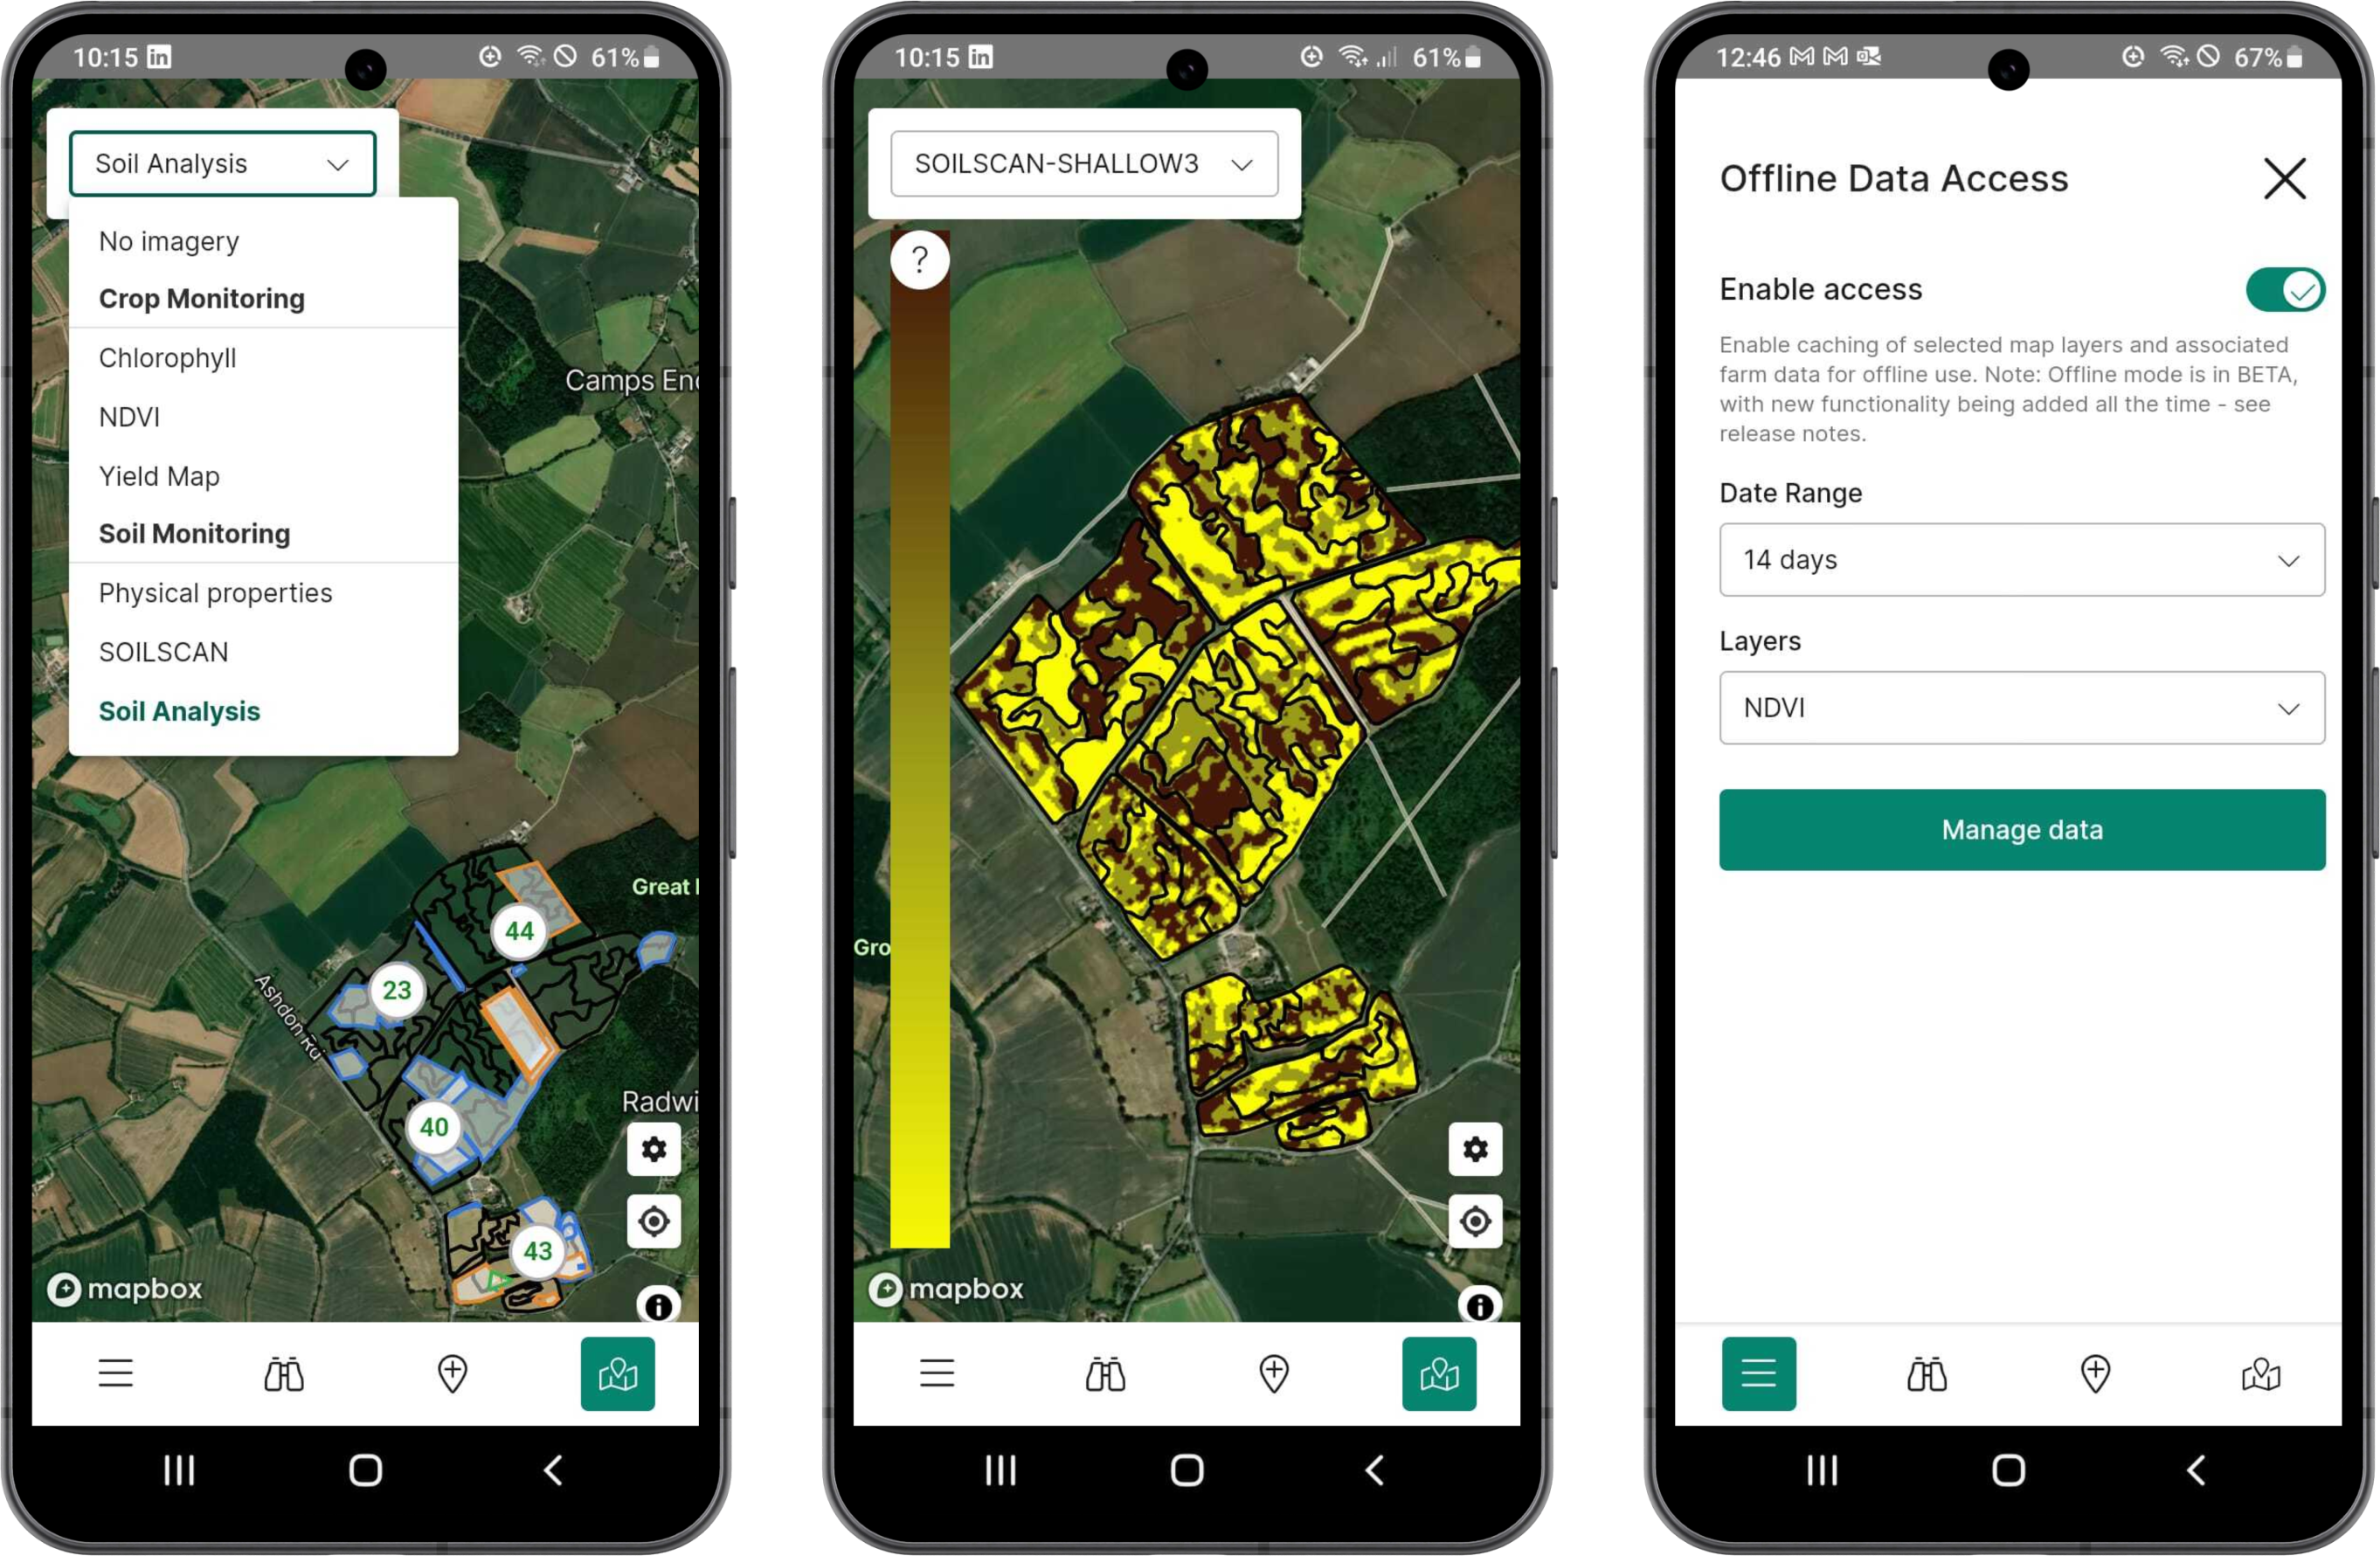
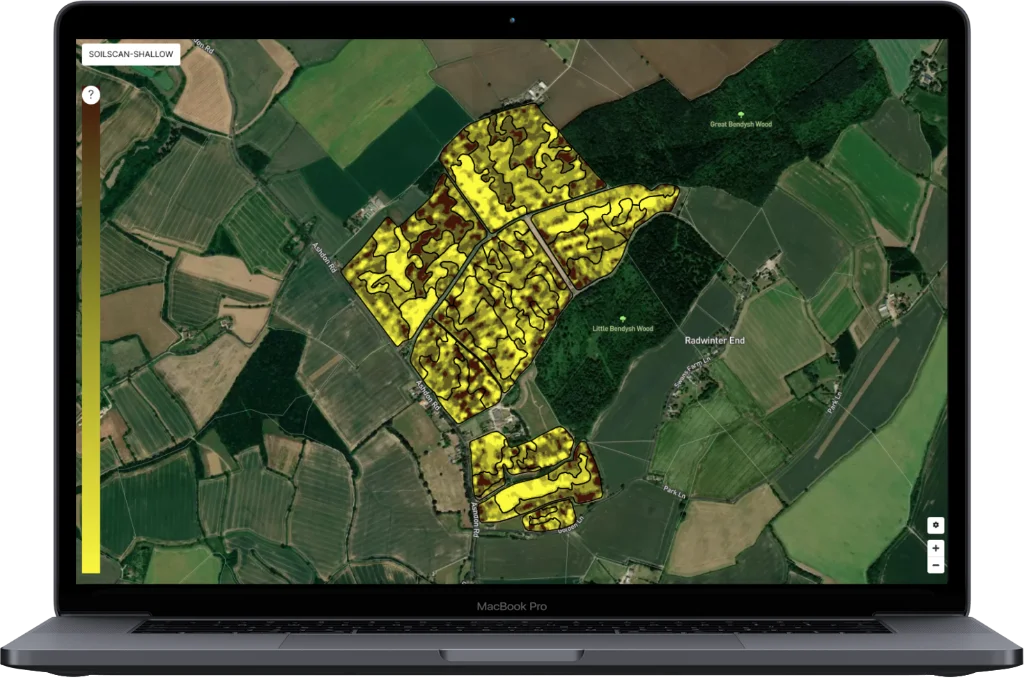
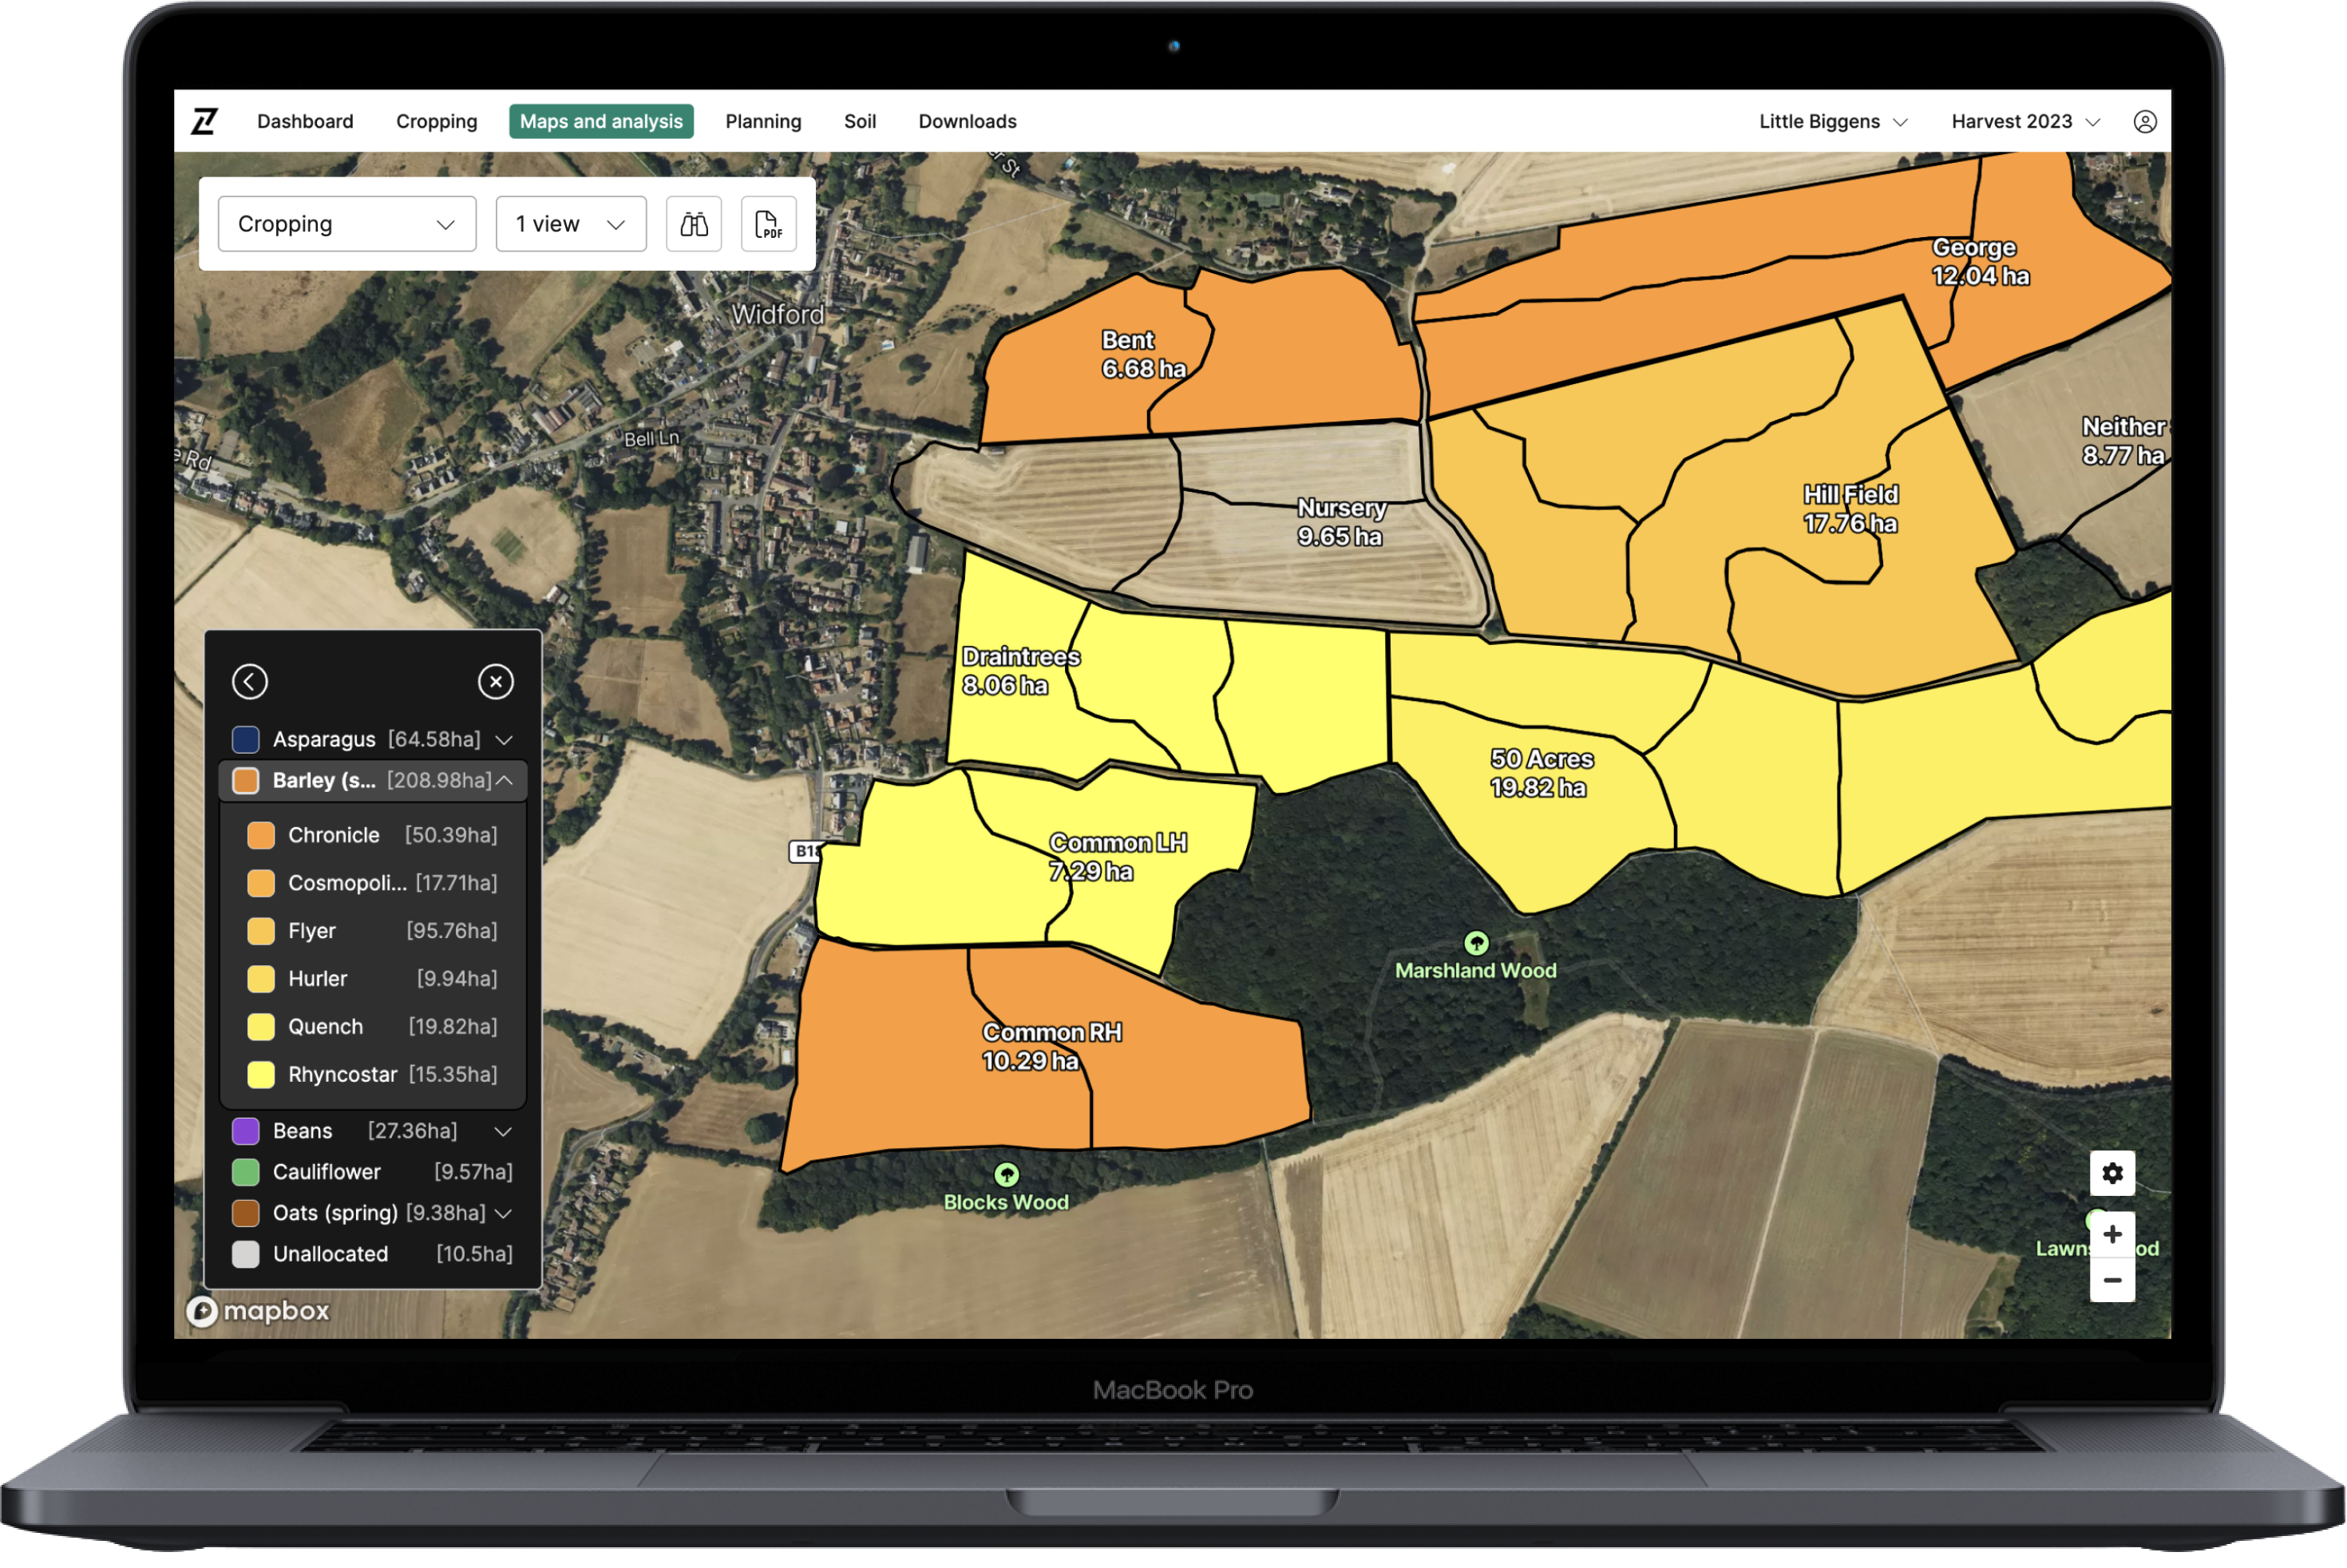
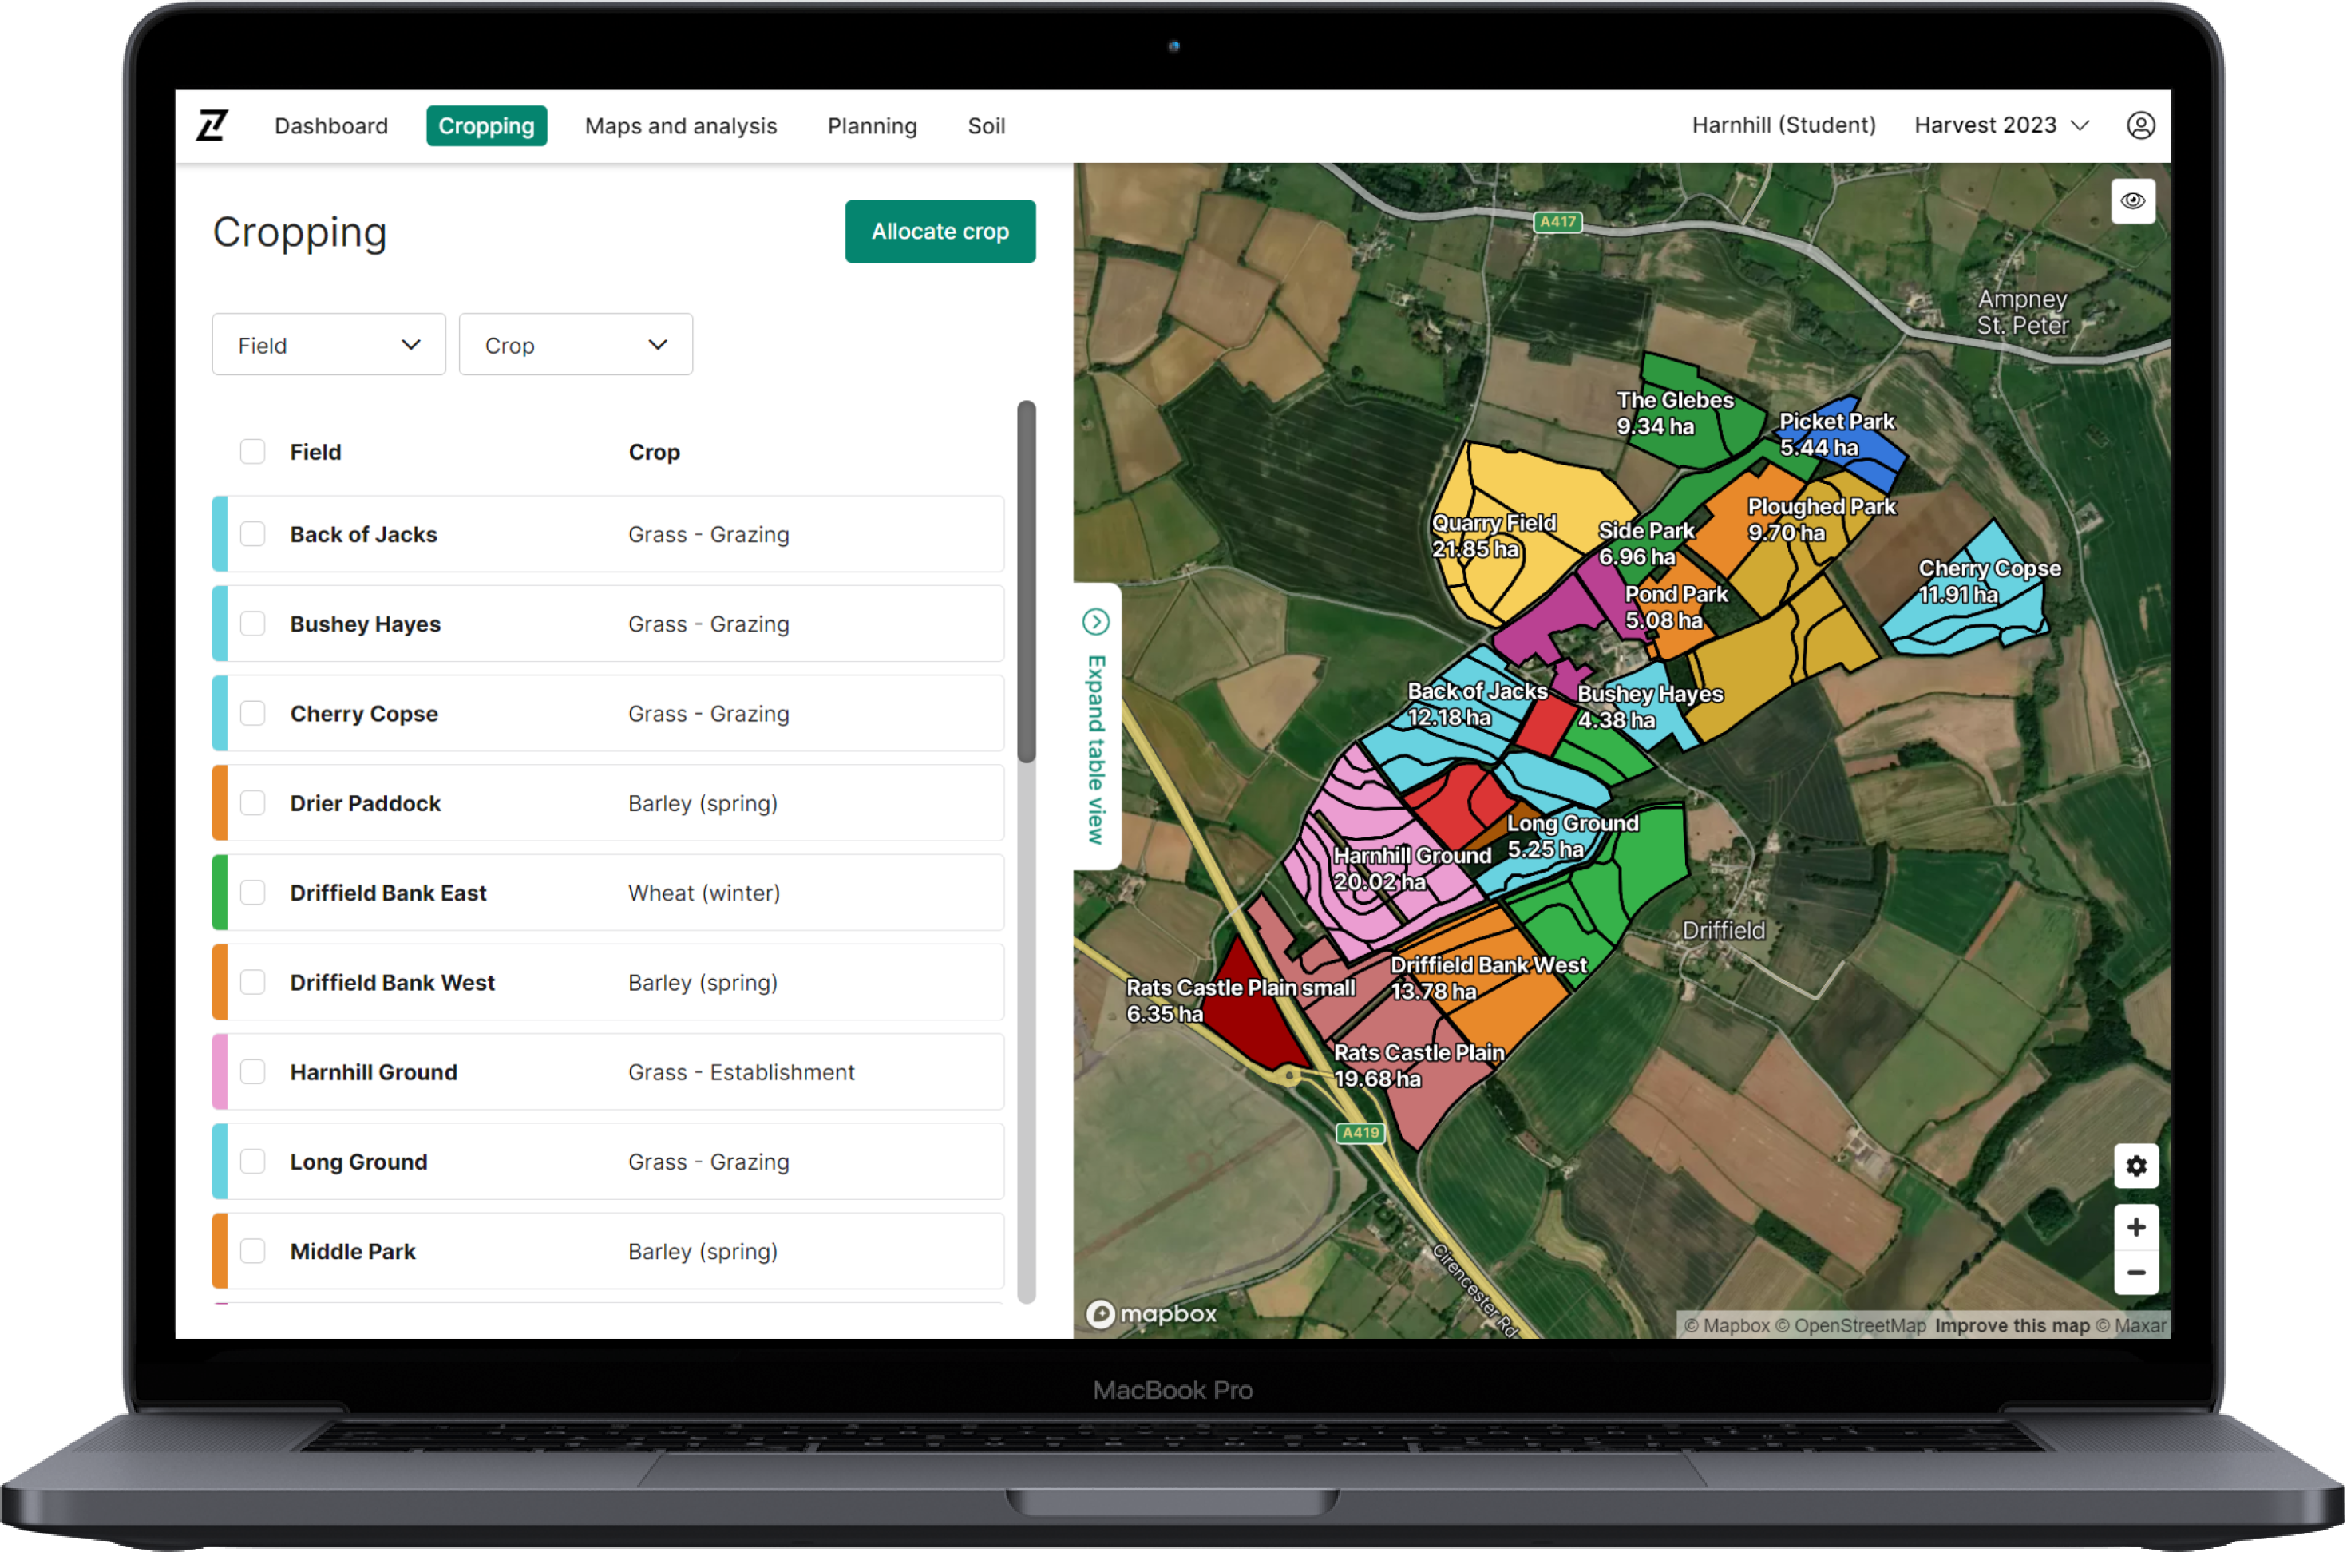
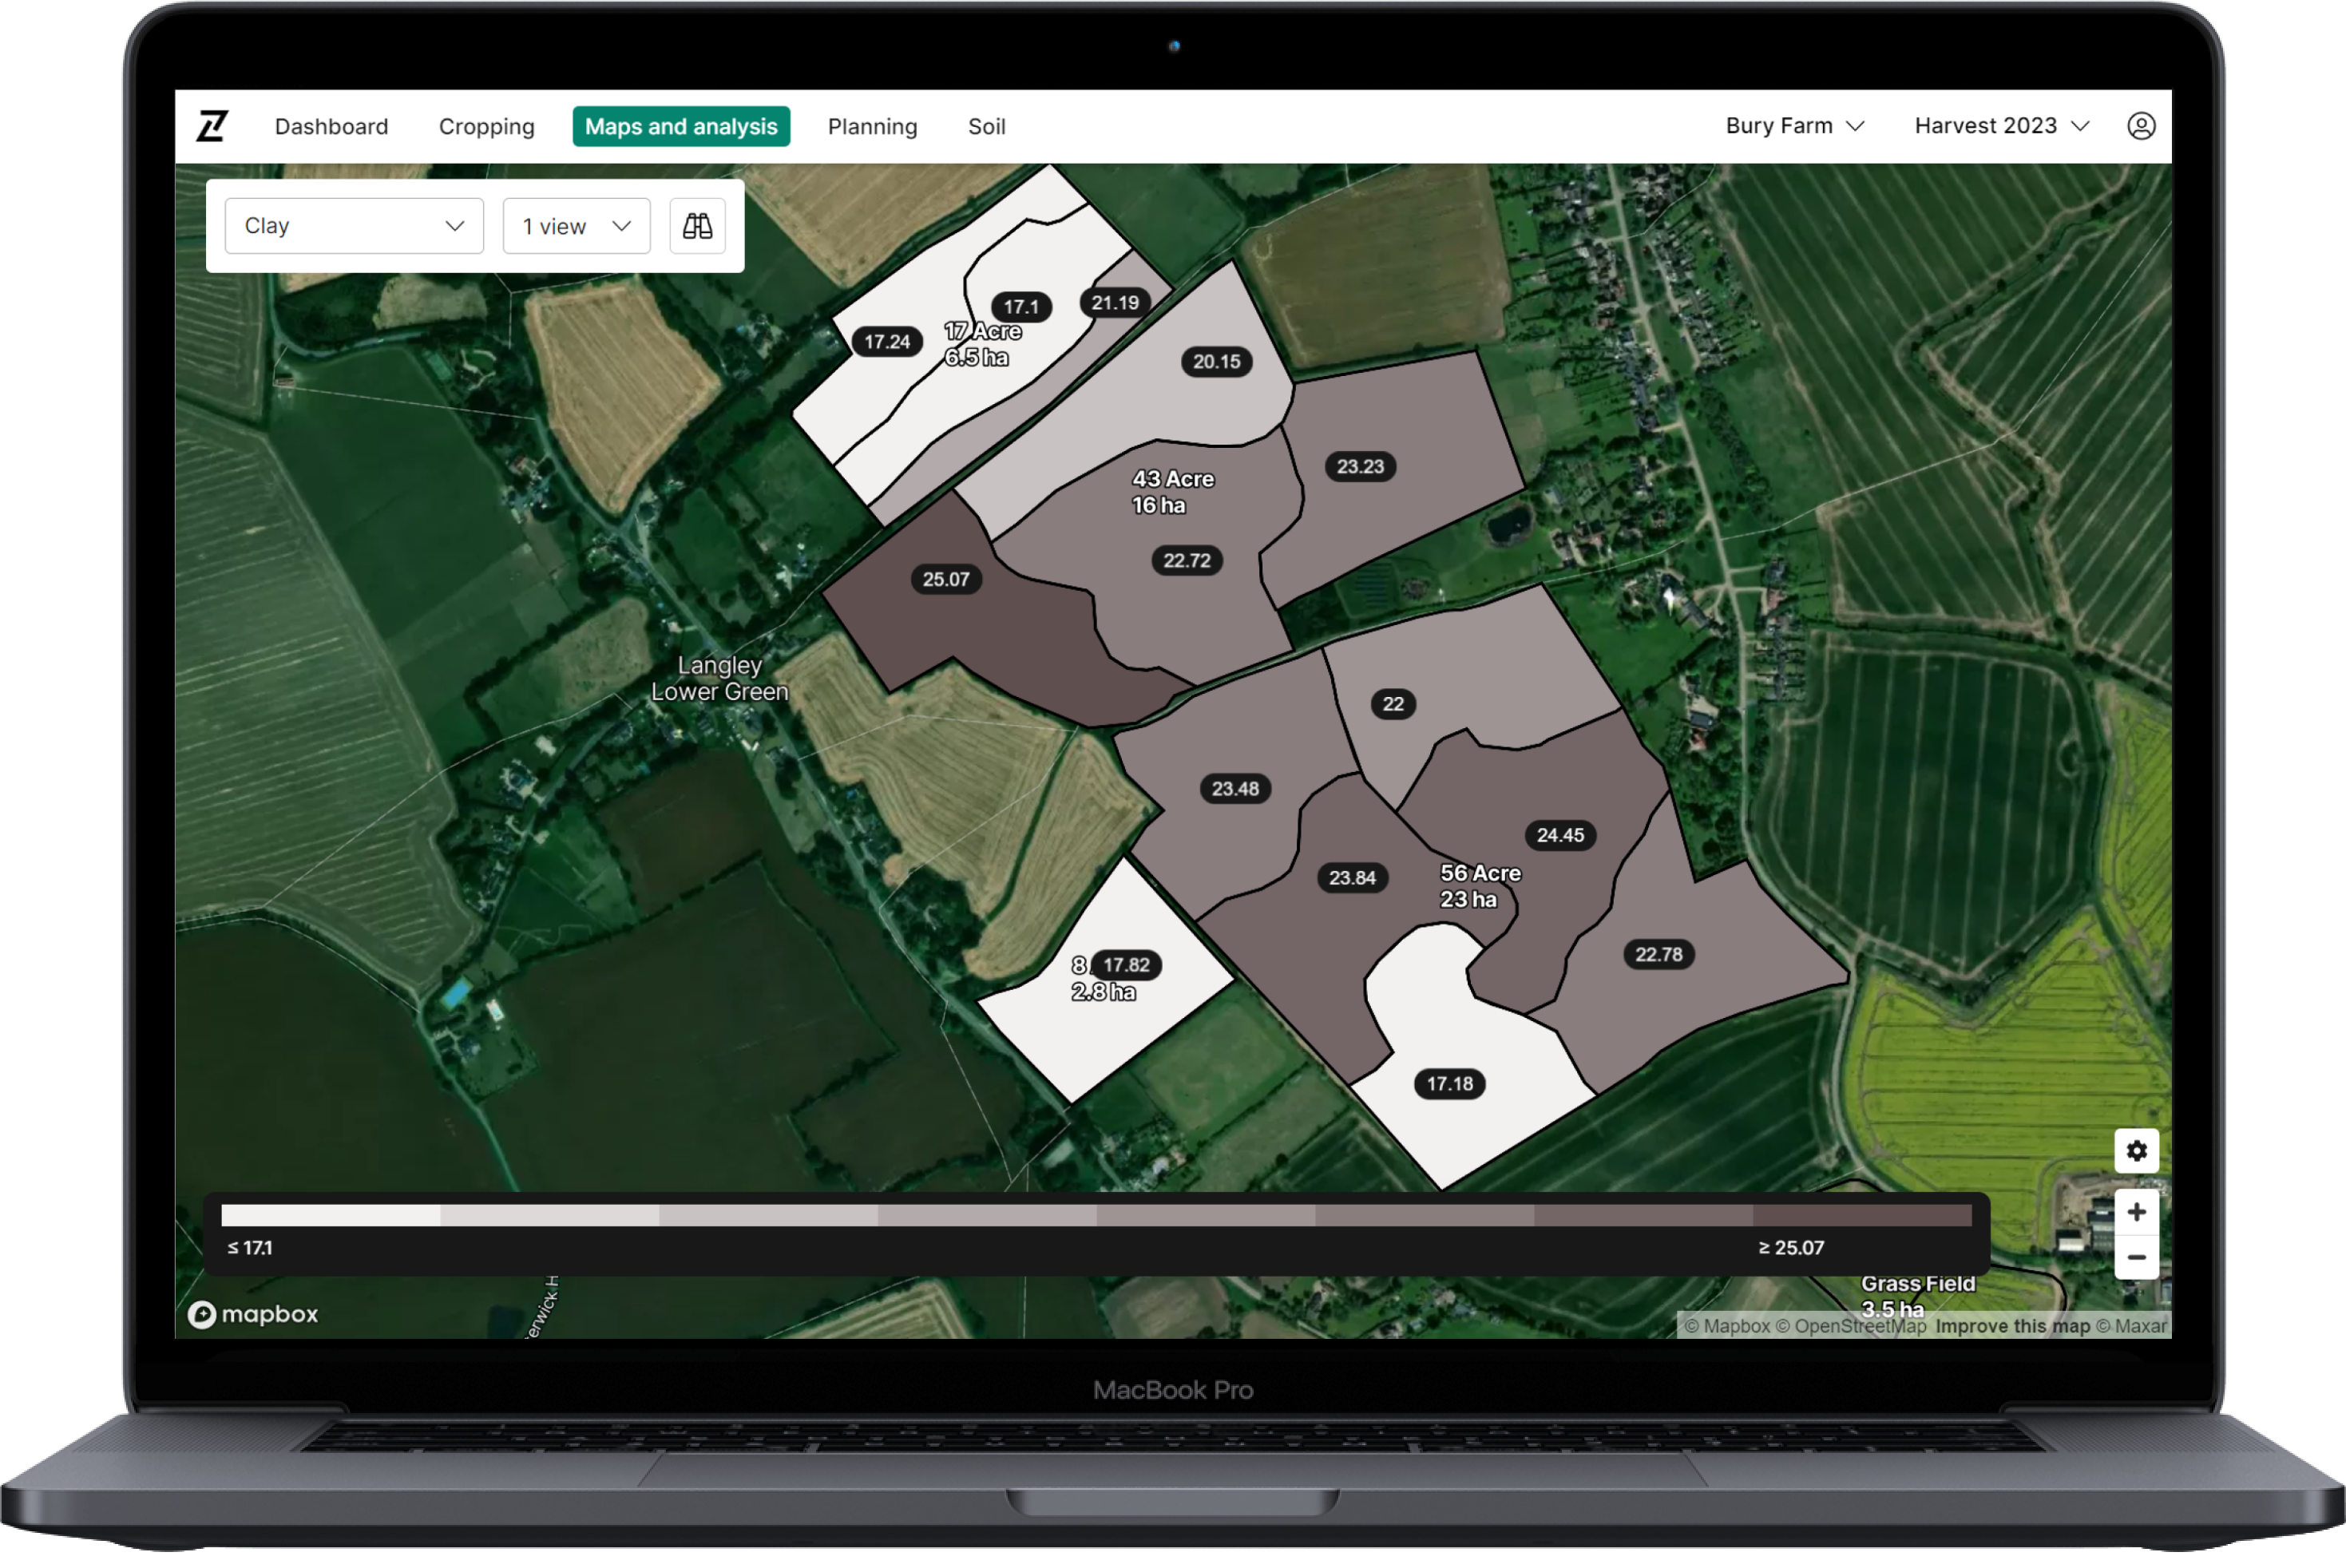
- Users can now view their latest clay, sand and silt soil sample data in Maps & Analysis alongside all other data layers and imagery types
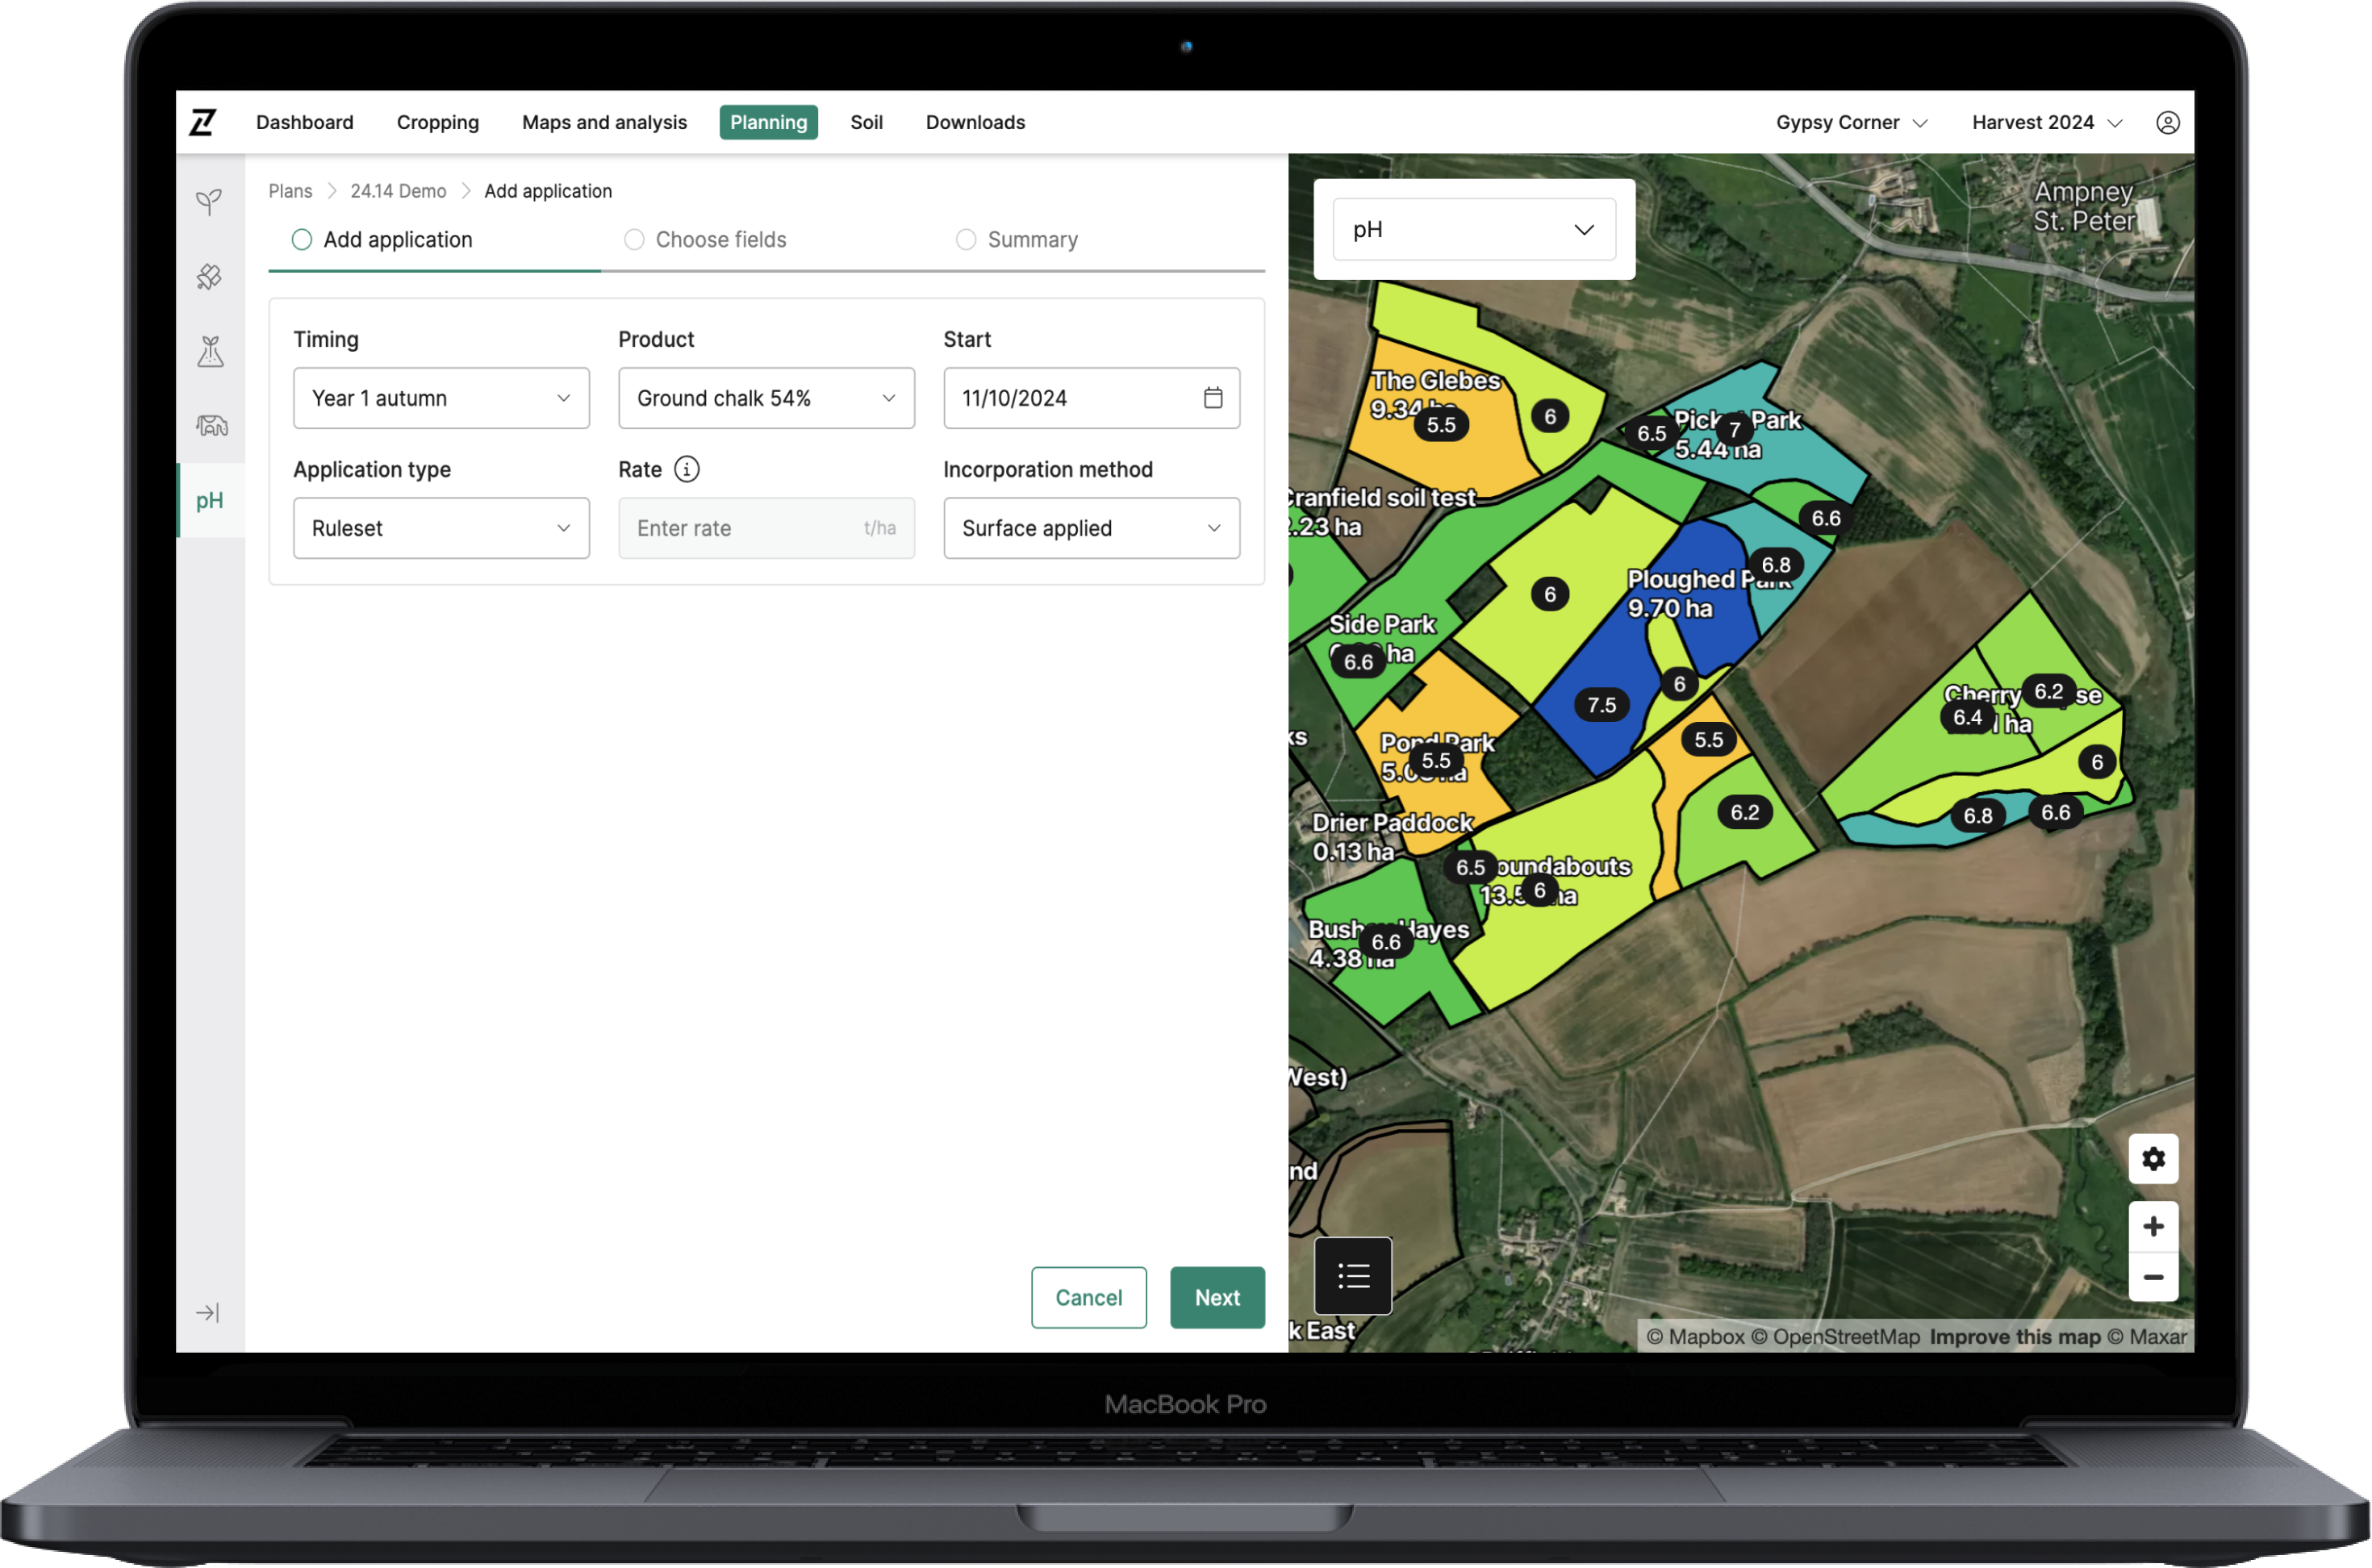
- Each zone is labelled with its percentage content of the particle type being viewed, and is coloured accordingly
- Soil constituent data can be analysed to aid management decisions such as cultivation techniques, travelability and irrigation/infiltration capacities
- In addition, users can compare multiple side-by-side views to check soil physical property data against satellite imagery, yield maps and more to help identify cause and effect
Log in to Contour to check out the updates today, and please send any feedback you may have to info@digital.originenterprises.com to help us improve.