Physical properties reporting

Contour – Physical properties and field boundary reports

Today’s update to Contour increases the reporting capability from Maps and Analysis by adding a further 13 layers. Reports are now available on the 12 physical properties layers (where data exists) and the all new field boundary layer.

Here’s how:

  • View the new field boundary layer in Maps and Analysis at any time by selecting it in the layer selection dropdown.
  • Select the PDF icon in the Maps and Analysis selection panel to load the PDF generator. In the choose layers tab you will see the physical properties and the field boundary layers listed.
  • Either select all layers in a heading or expand the heading to select layers individually.
  • Select to show zone boundaries and labels on the field boundary report if desired.
  • Due to the large number of layers now available for reporting, it has been technically necessary to limit the number of layers in a report to 16. If more than 16 layers are needed, simply create more than one report.
Other updates:

  • Legends no longer cover fields in the Maps and Analysis reports.
  • Zones have been removed from the cropping layer report.
  • Field names have been removed from all reports except cropping and field boundaries.
  • Fixed an issue where legend colours were inverted for the organic matter layer.
  • The organic matter layer legend has been fixed at a maximum of 10 categories.
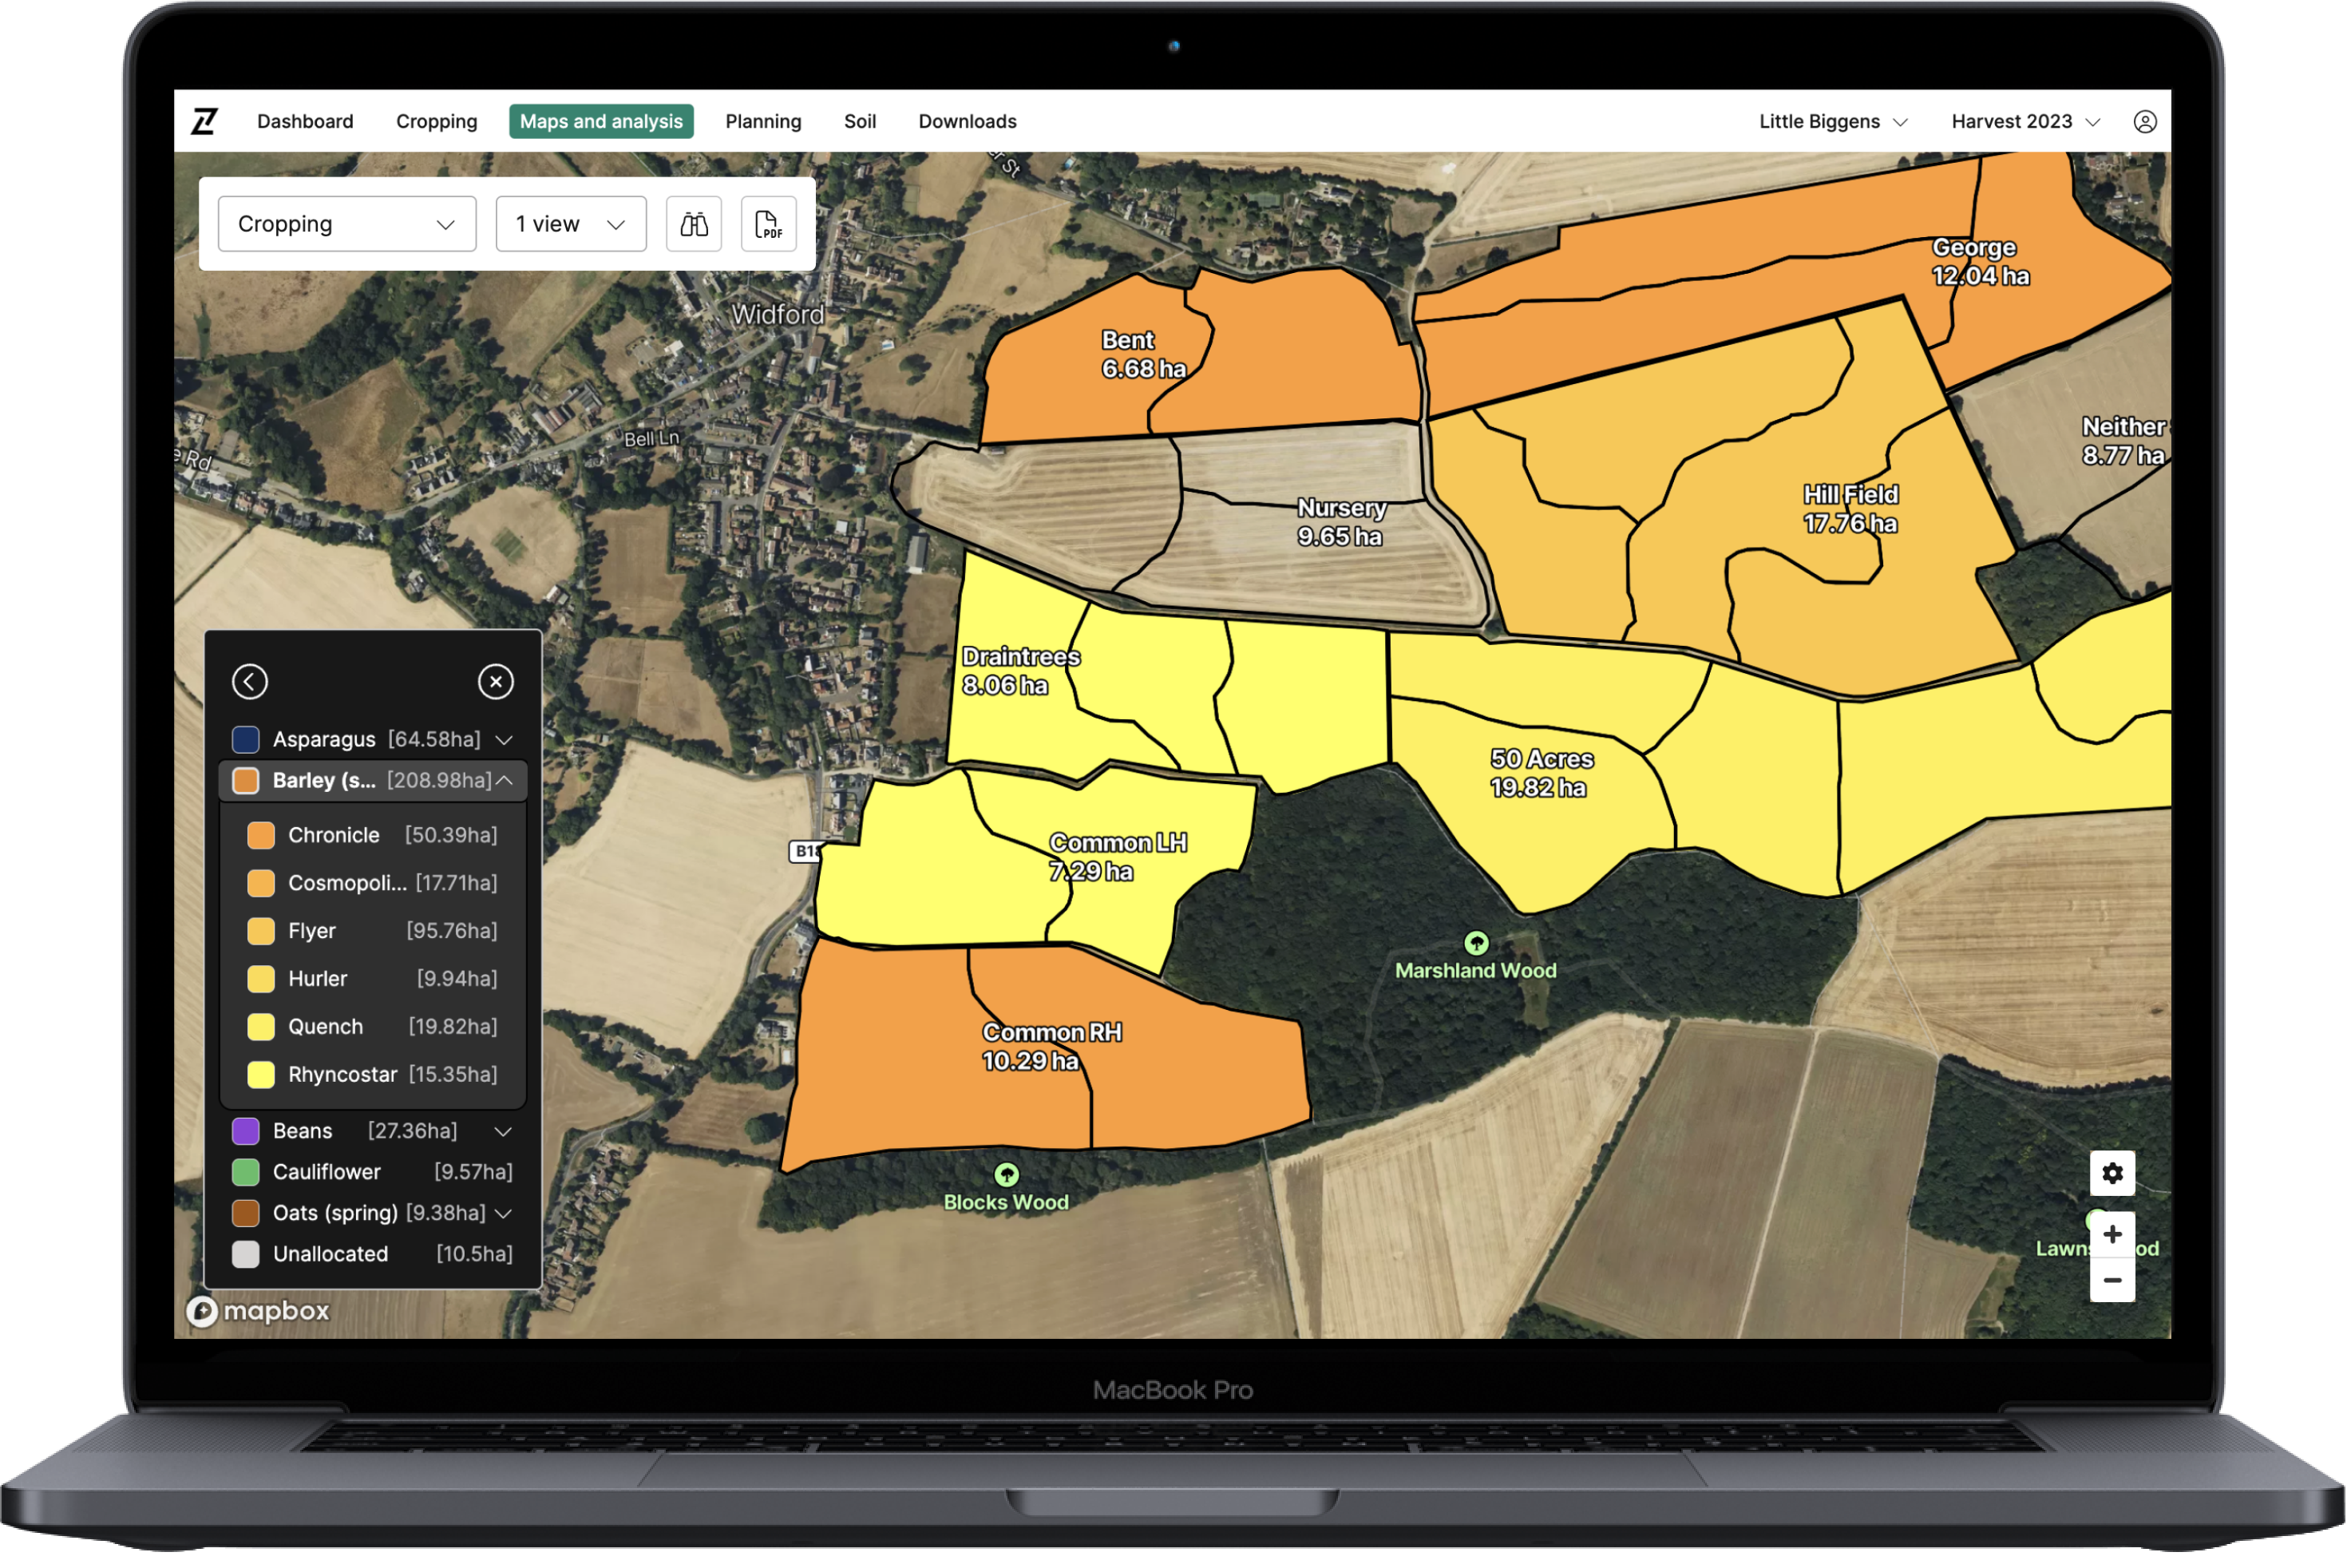
  • Crop and variety areas have been added to the legend of the cropping layer so that they show in both Maps and Analysis and the cropping layer report (see image above).

Log in to Contour to check out the updates today, and please send any feedback you may have to info@digital.originenterprises.com to help us keep improving.

Similar Posts