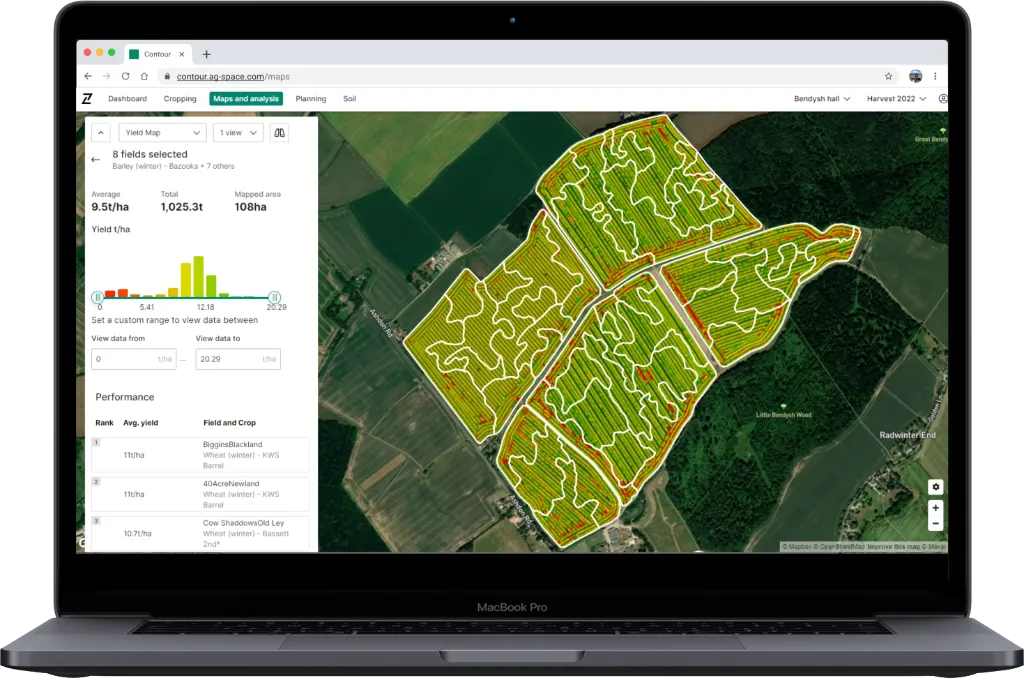
Cropping layer in Maps and Analysis
Contour release 3.11 includes the new cropping layer in Maps and Analysis. This new layer displays both crop and variety information in an easy to use way, alongside other visual data, being compatible with the multi view capability in Maps and Analysis to facilitate comparisons. Cropping data over previous years may be viewed by changing the harvest year selector in the top right hand corner (or via the burger menu on mobile).
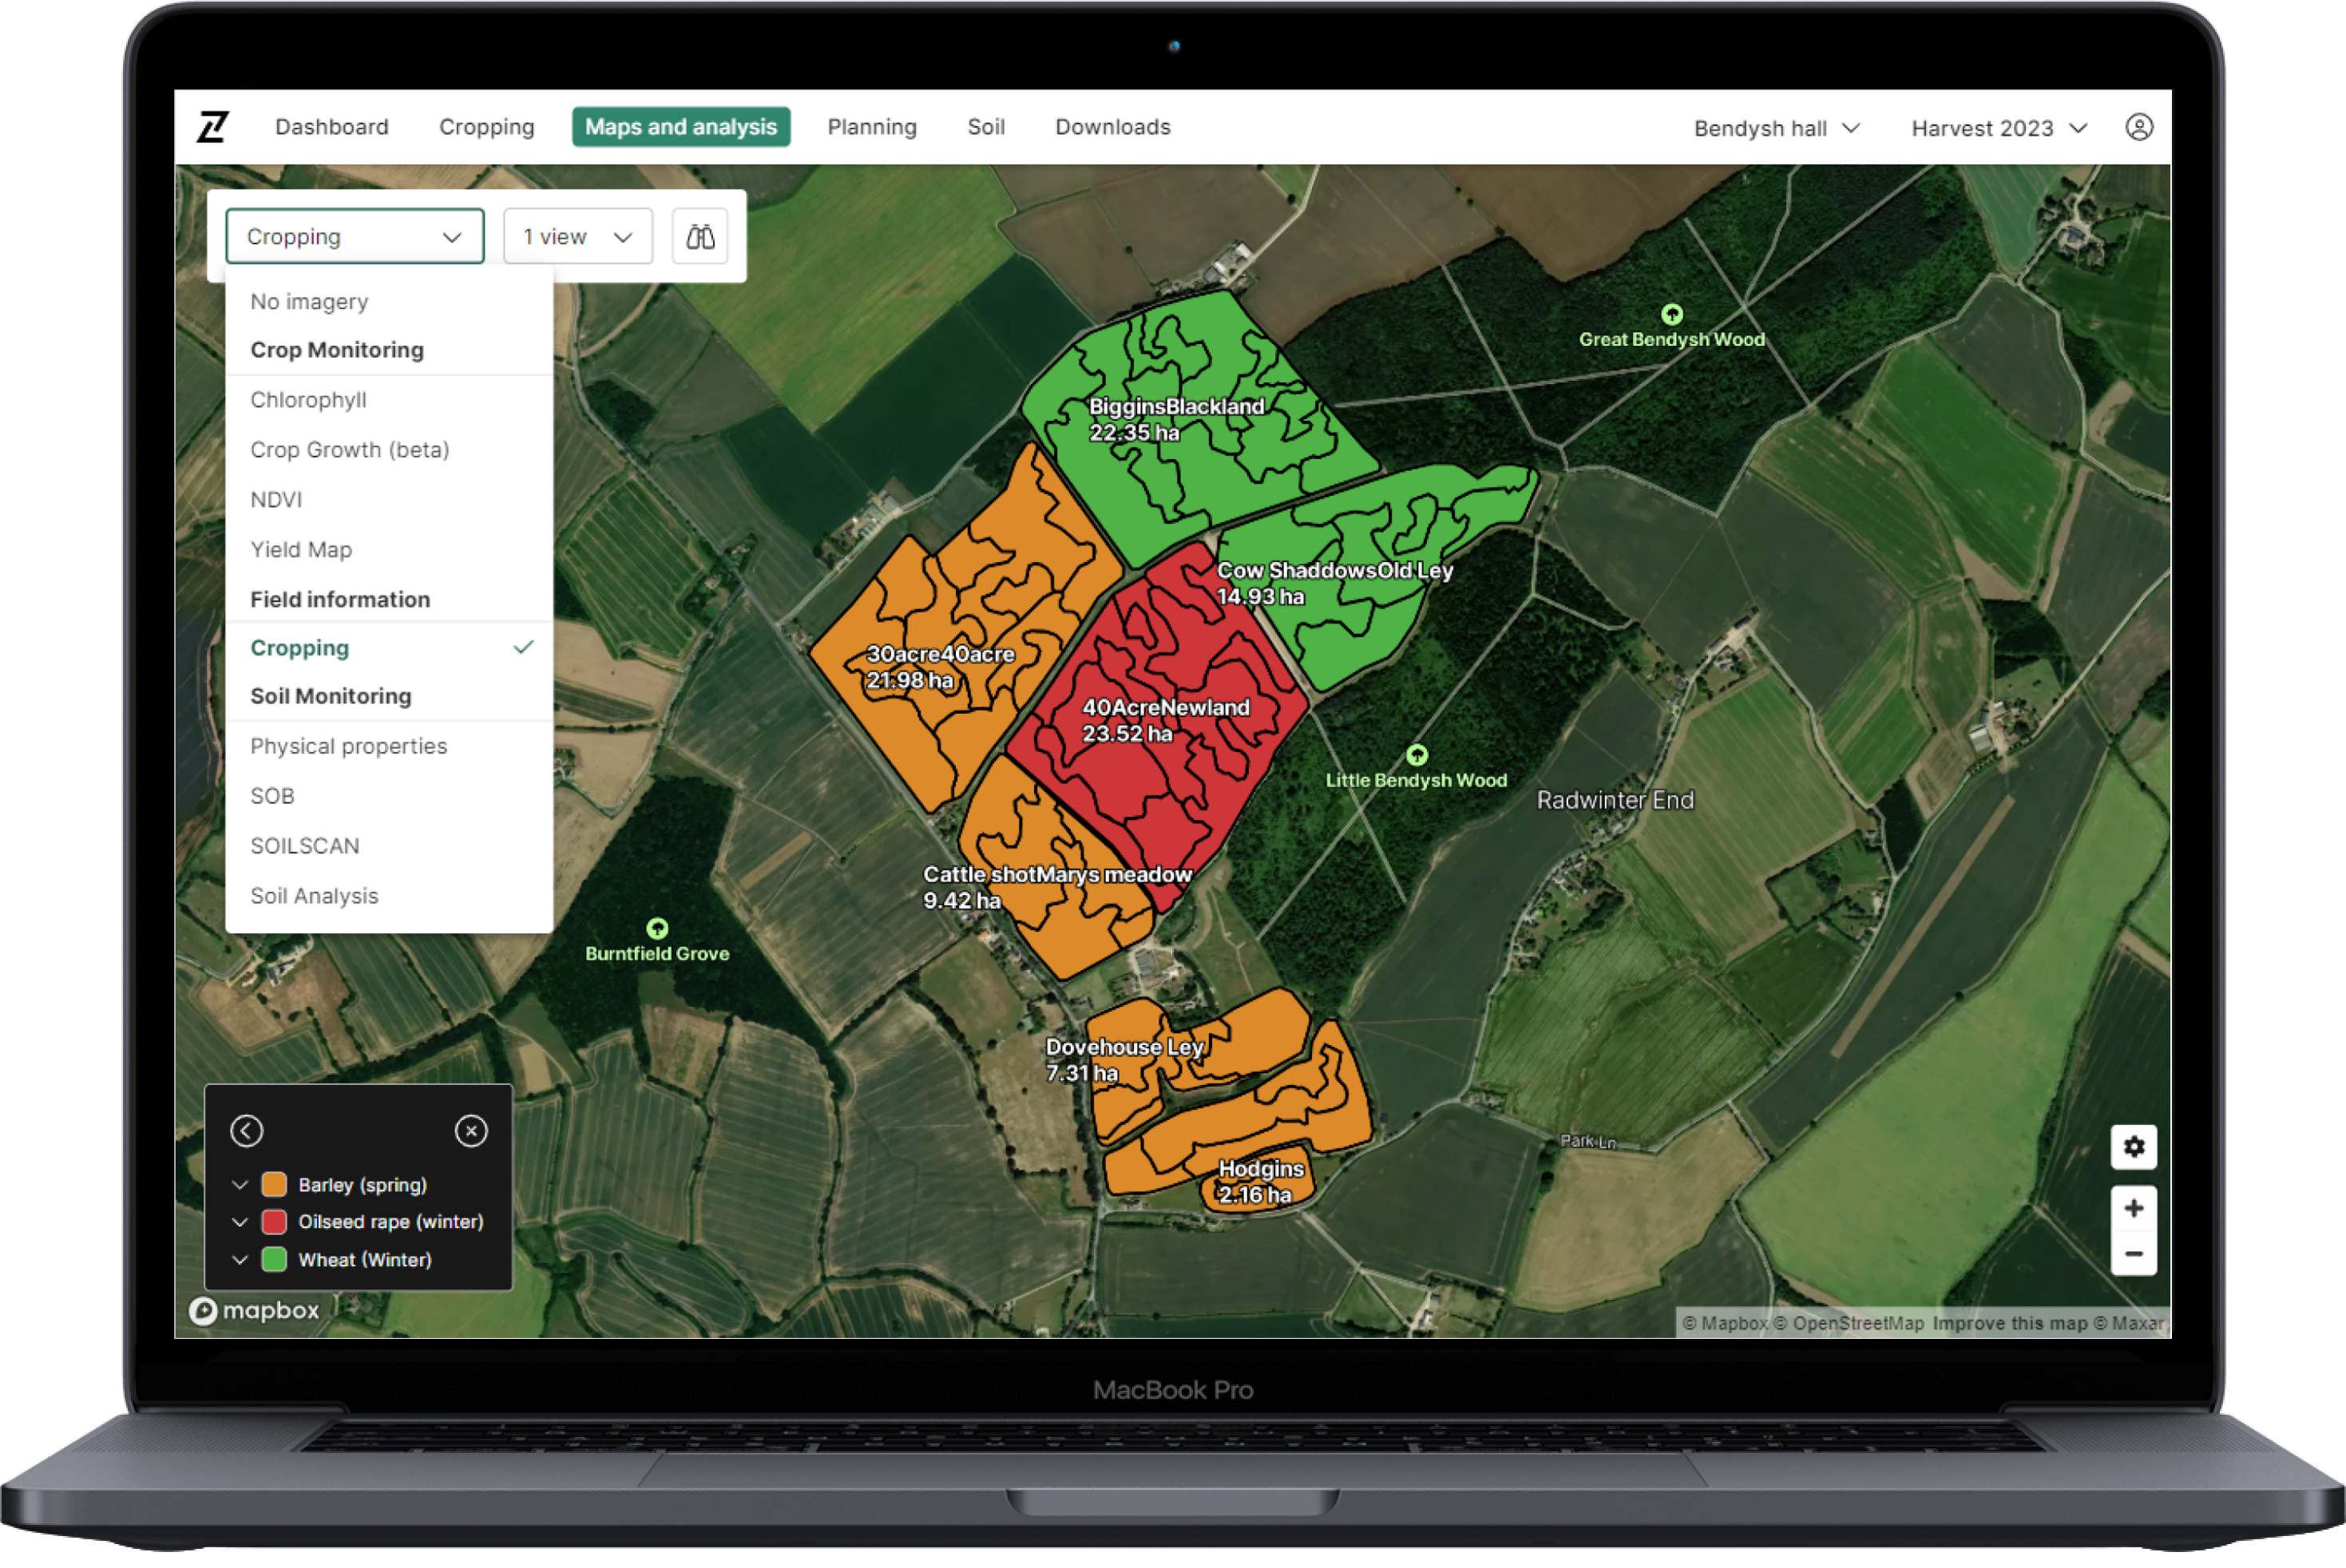
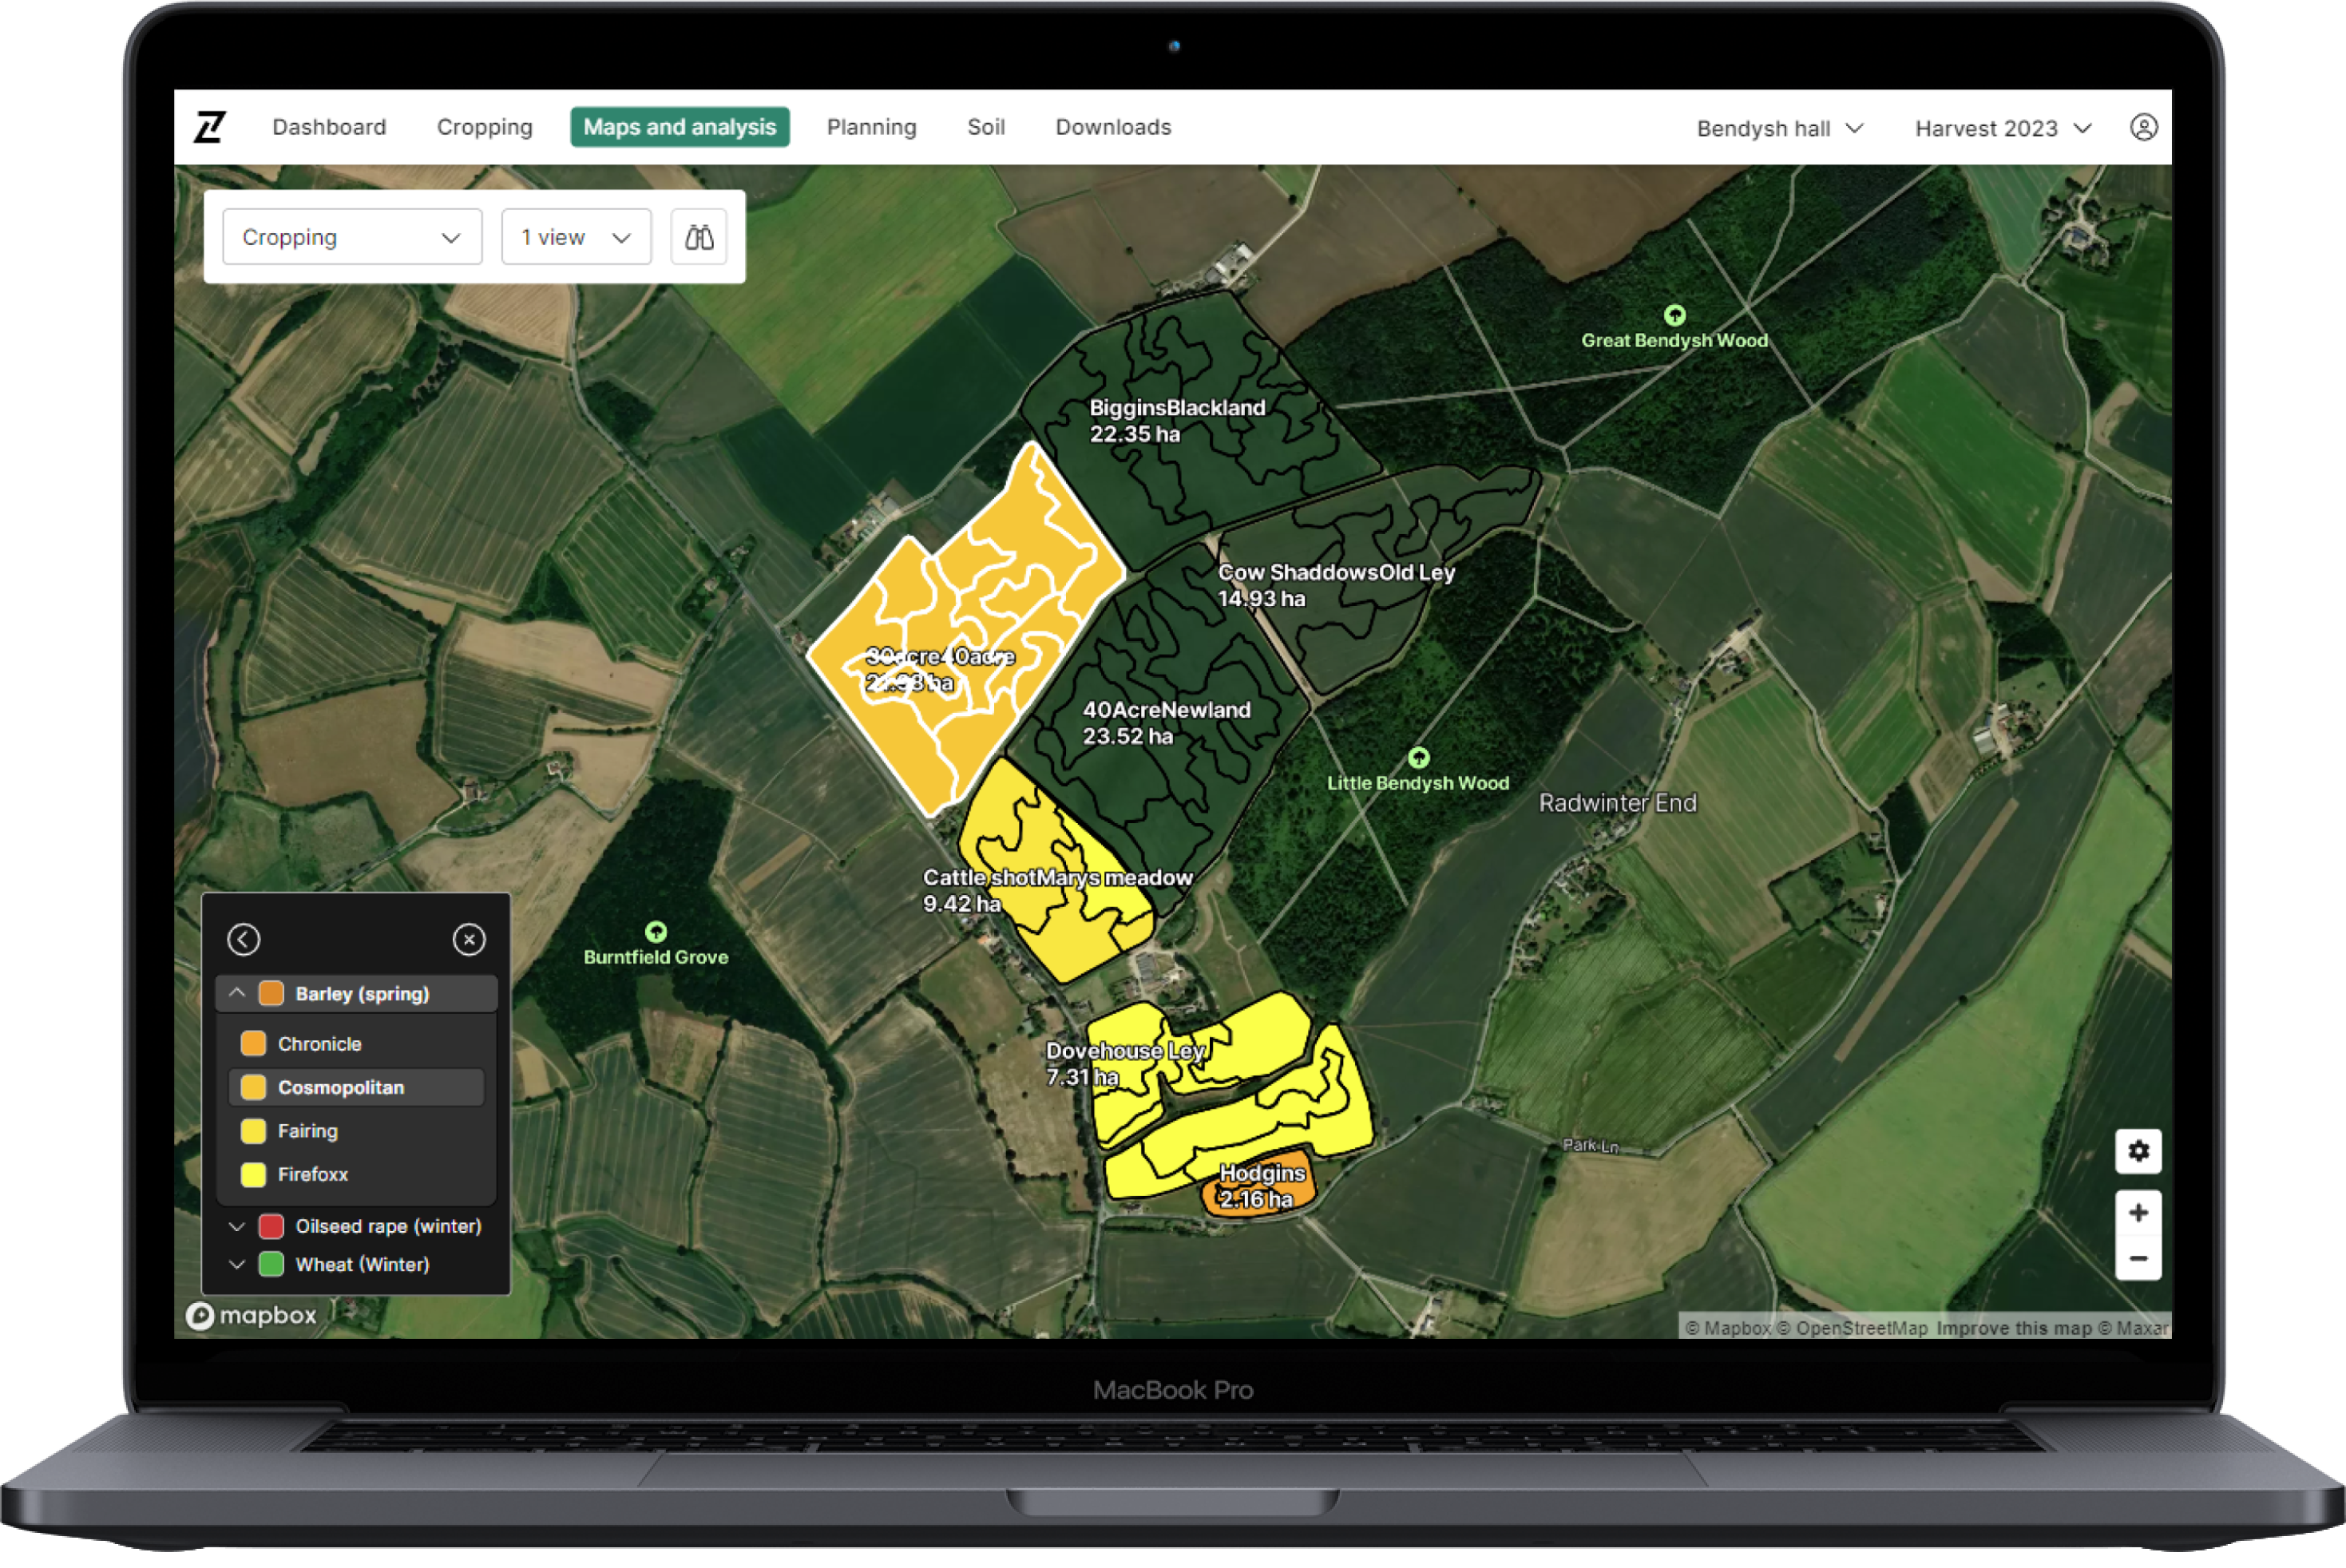
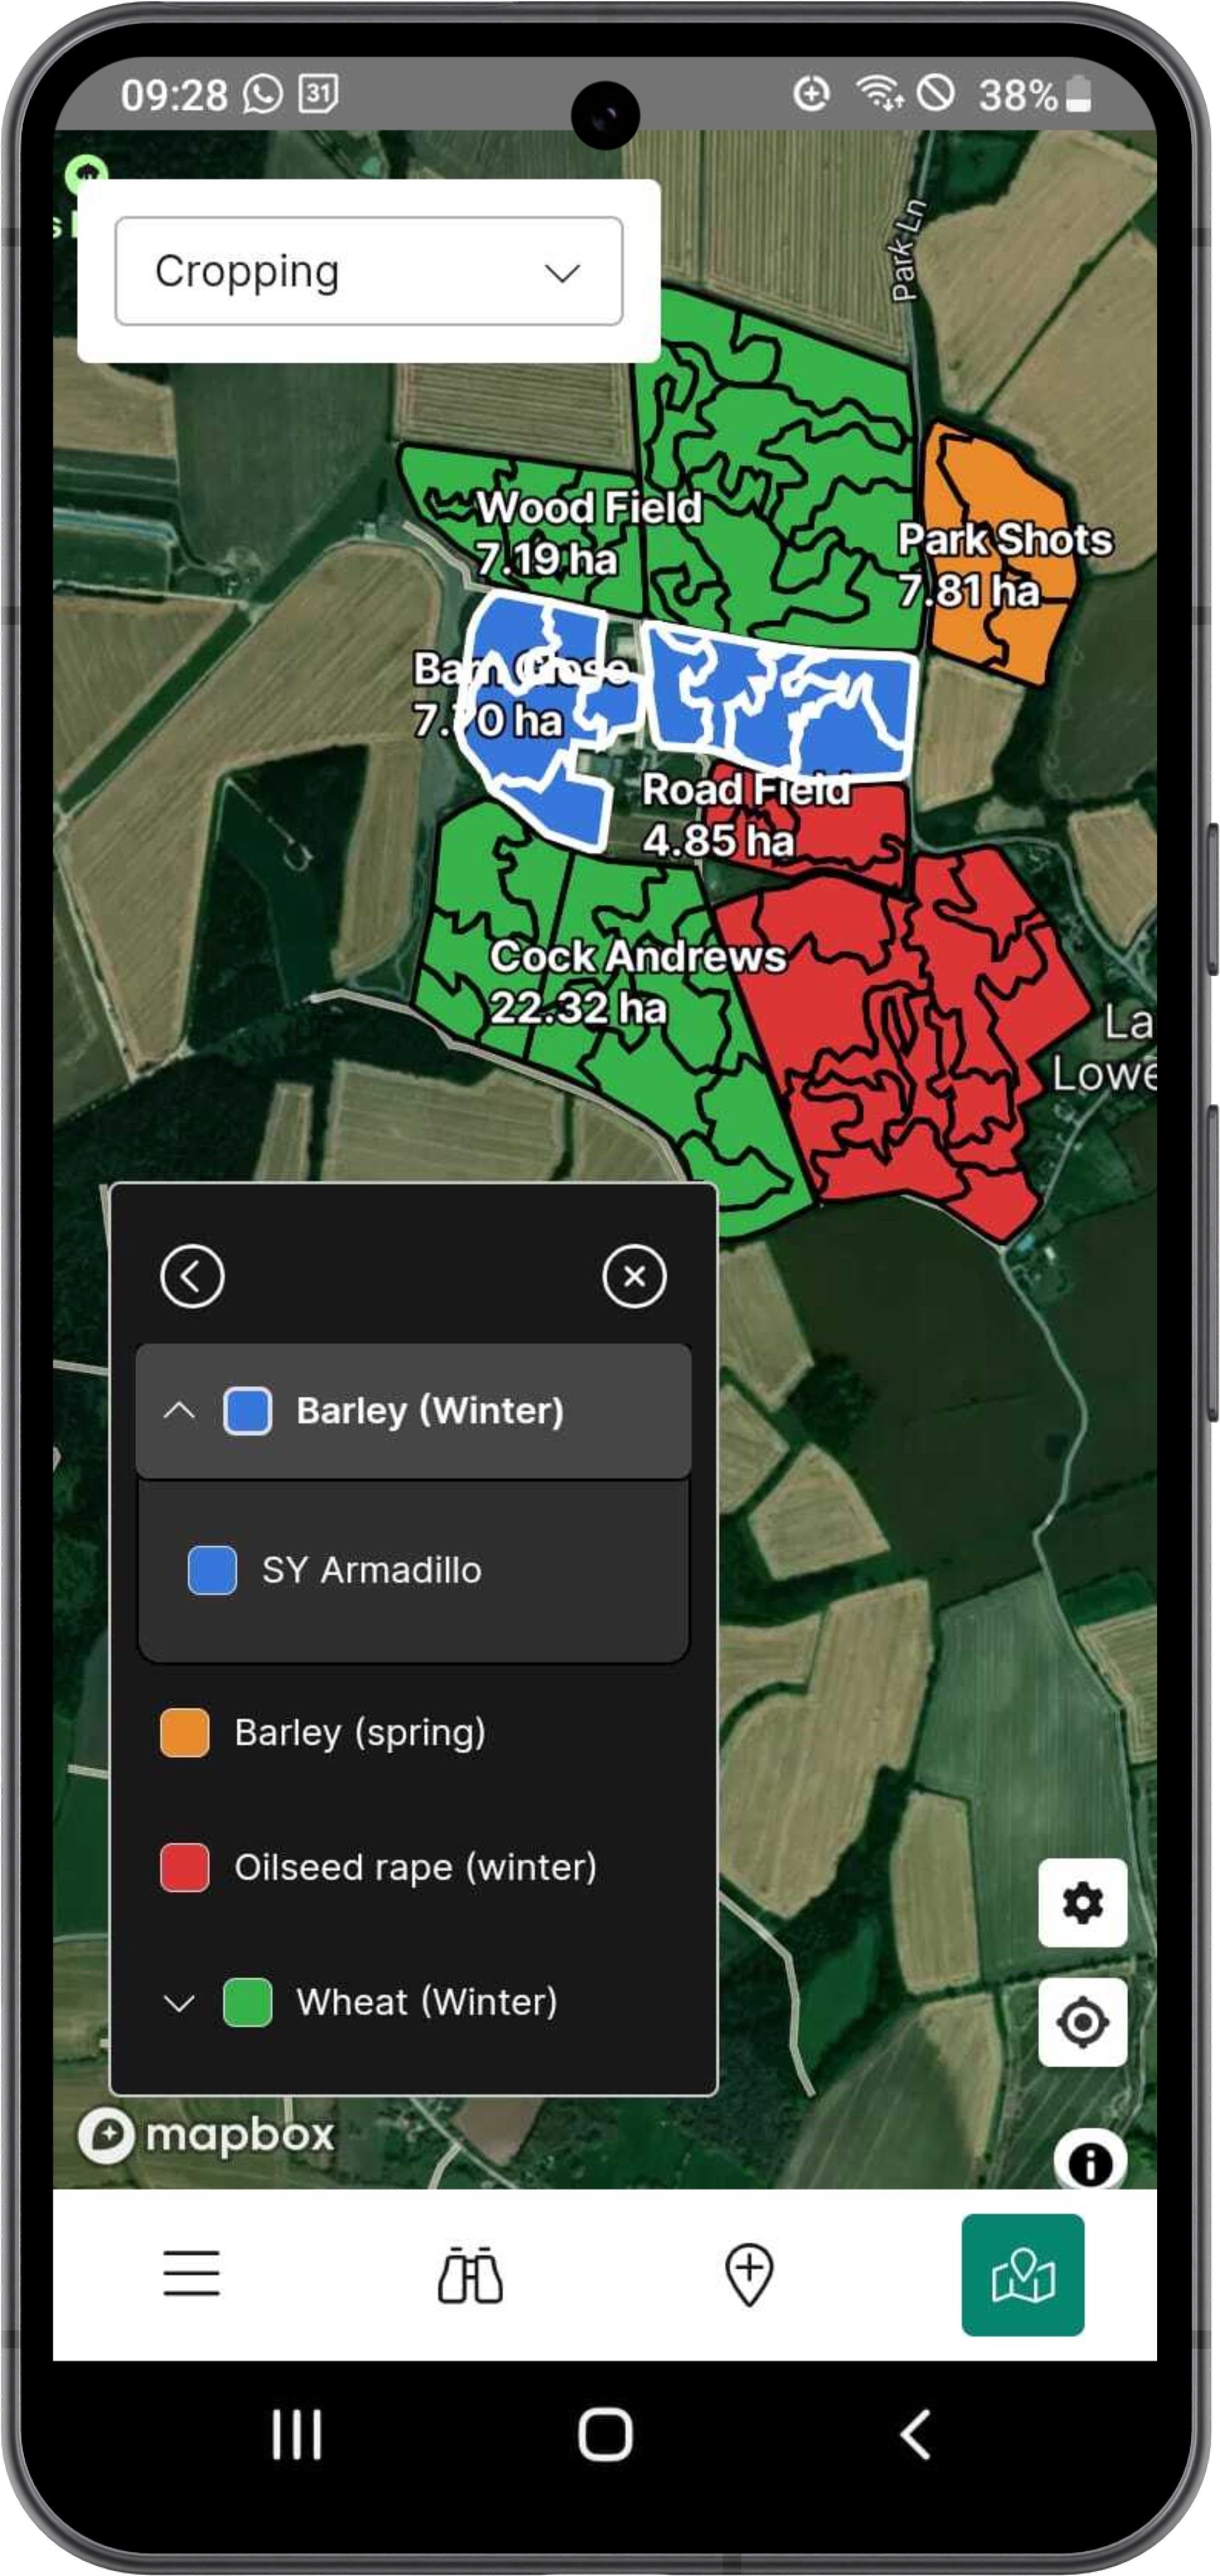
Included is a new legend that shows varieties tiered under expandable crop headings. In the expanded state, all varieties for that crop are listed and the map changes to showing just the varieties for that crop, coloured as a subset of the main crop colour. The usual hover over functionality you are accustomed to in other Maps and Analysis layers is retained here on web (tap to select legend item in mobile).
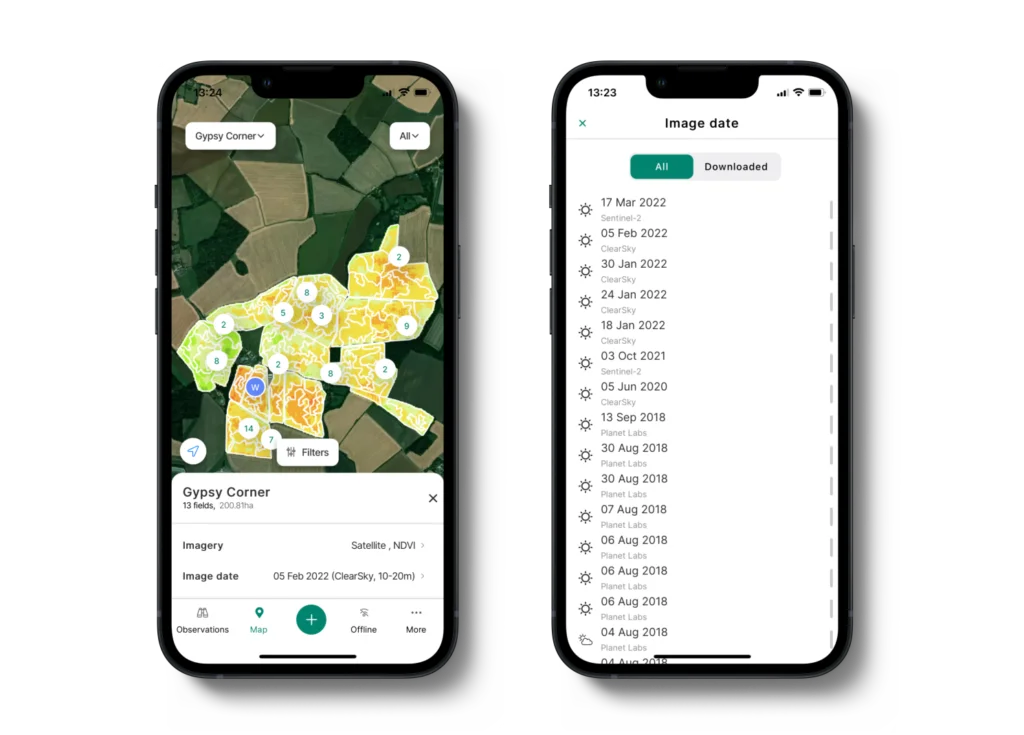
This new layer puts visual cropping data into the mobile app for the first time, and is also available offline. One of the reasons for getting the cropping layer into Maps and Analysis was to be able to export it to PDF. The ability to export the cropping layer to PDF is coming up in a future release, and we will also be adding more layers into Maps and Analysis, so don’t forget to check back soon!
We have additionally made a number of small updates to Contour to enhance user experience by improving navigation, usability, and performance:
- Seed plan cards display rate units, and prevent selection of plans with differing units.
- Seed plan downloads display the plan name and “generated by” on the Downloads page. Multi-plan downloads display the plan names on hover over.
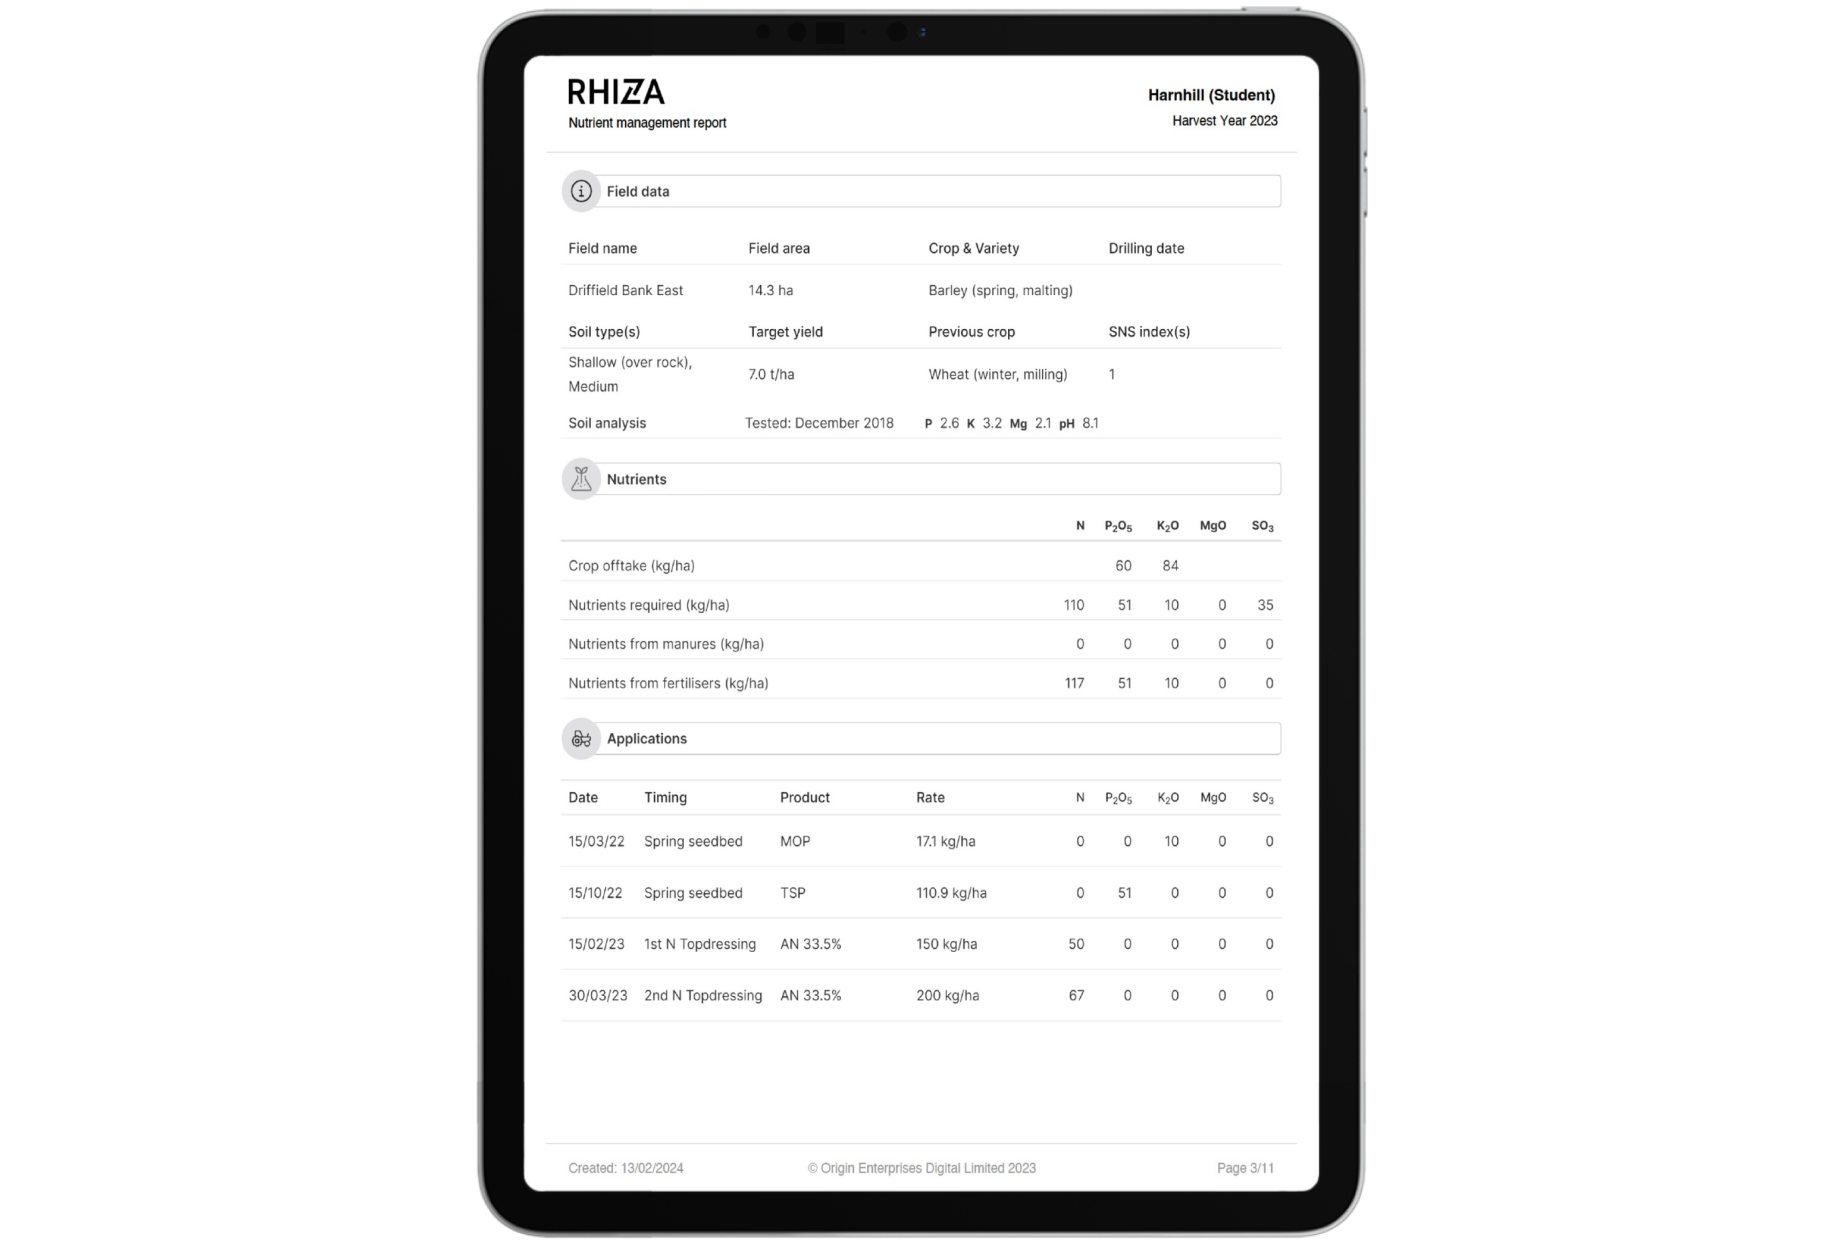
- Updated scaling of PDF reports.
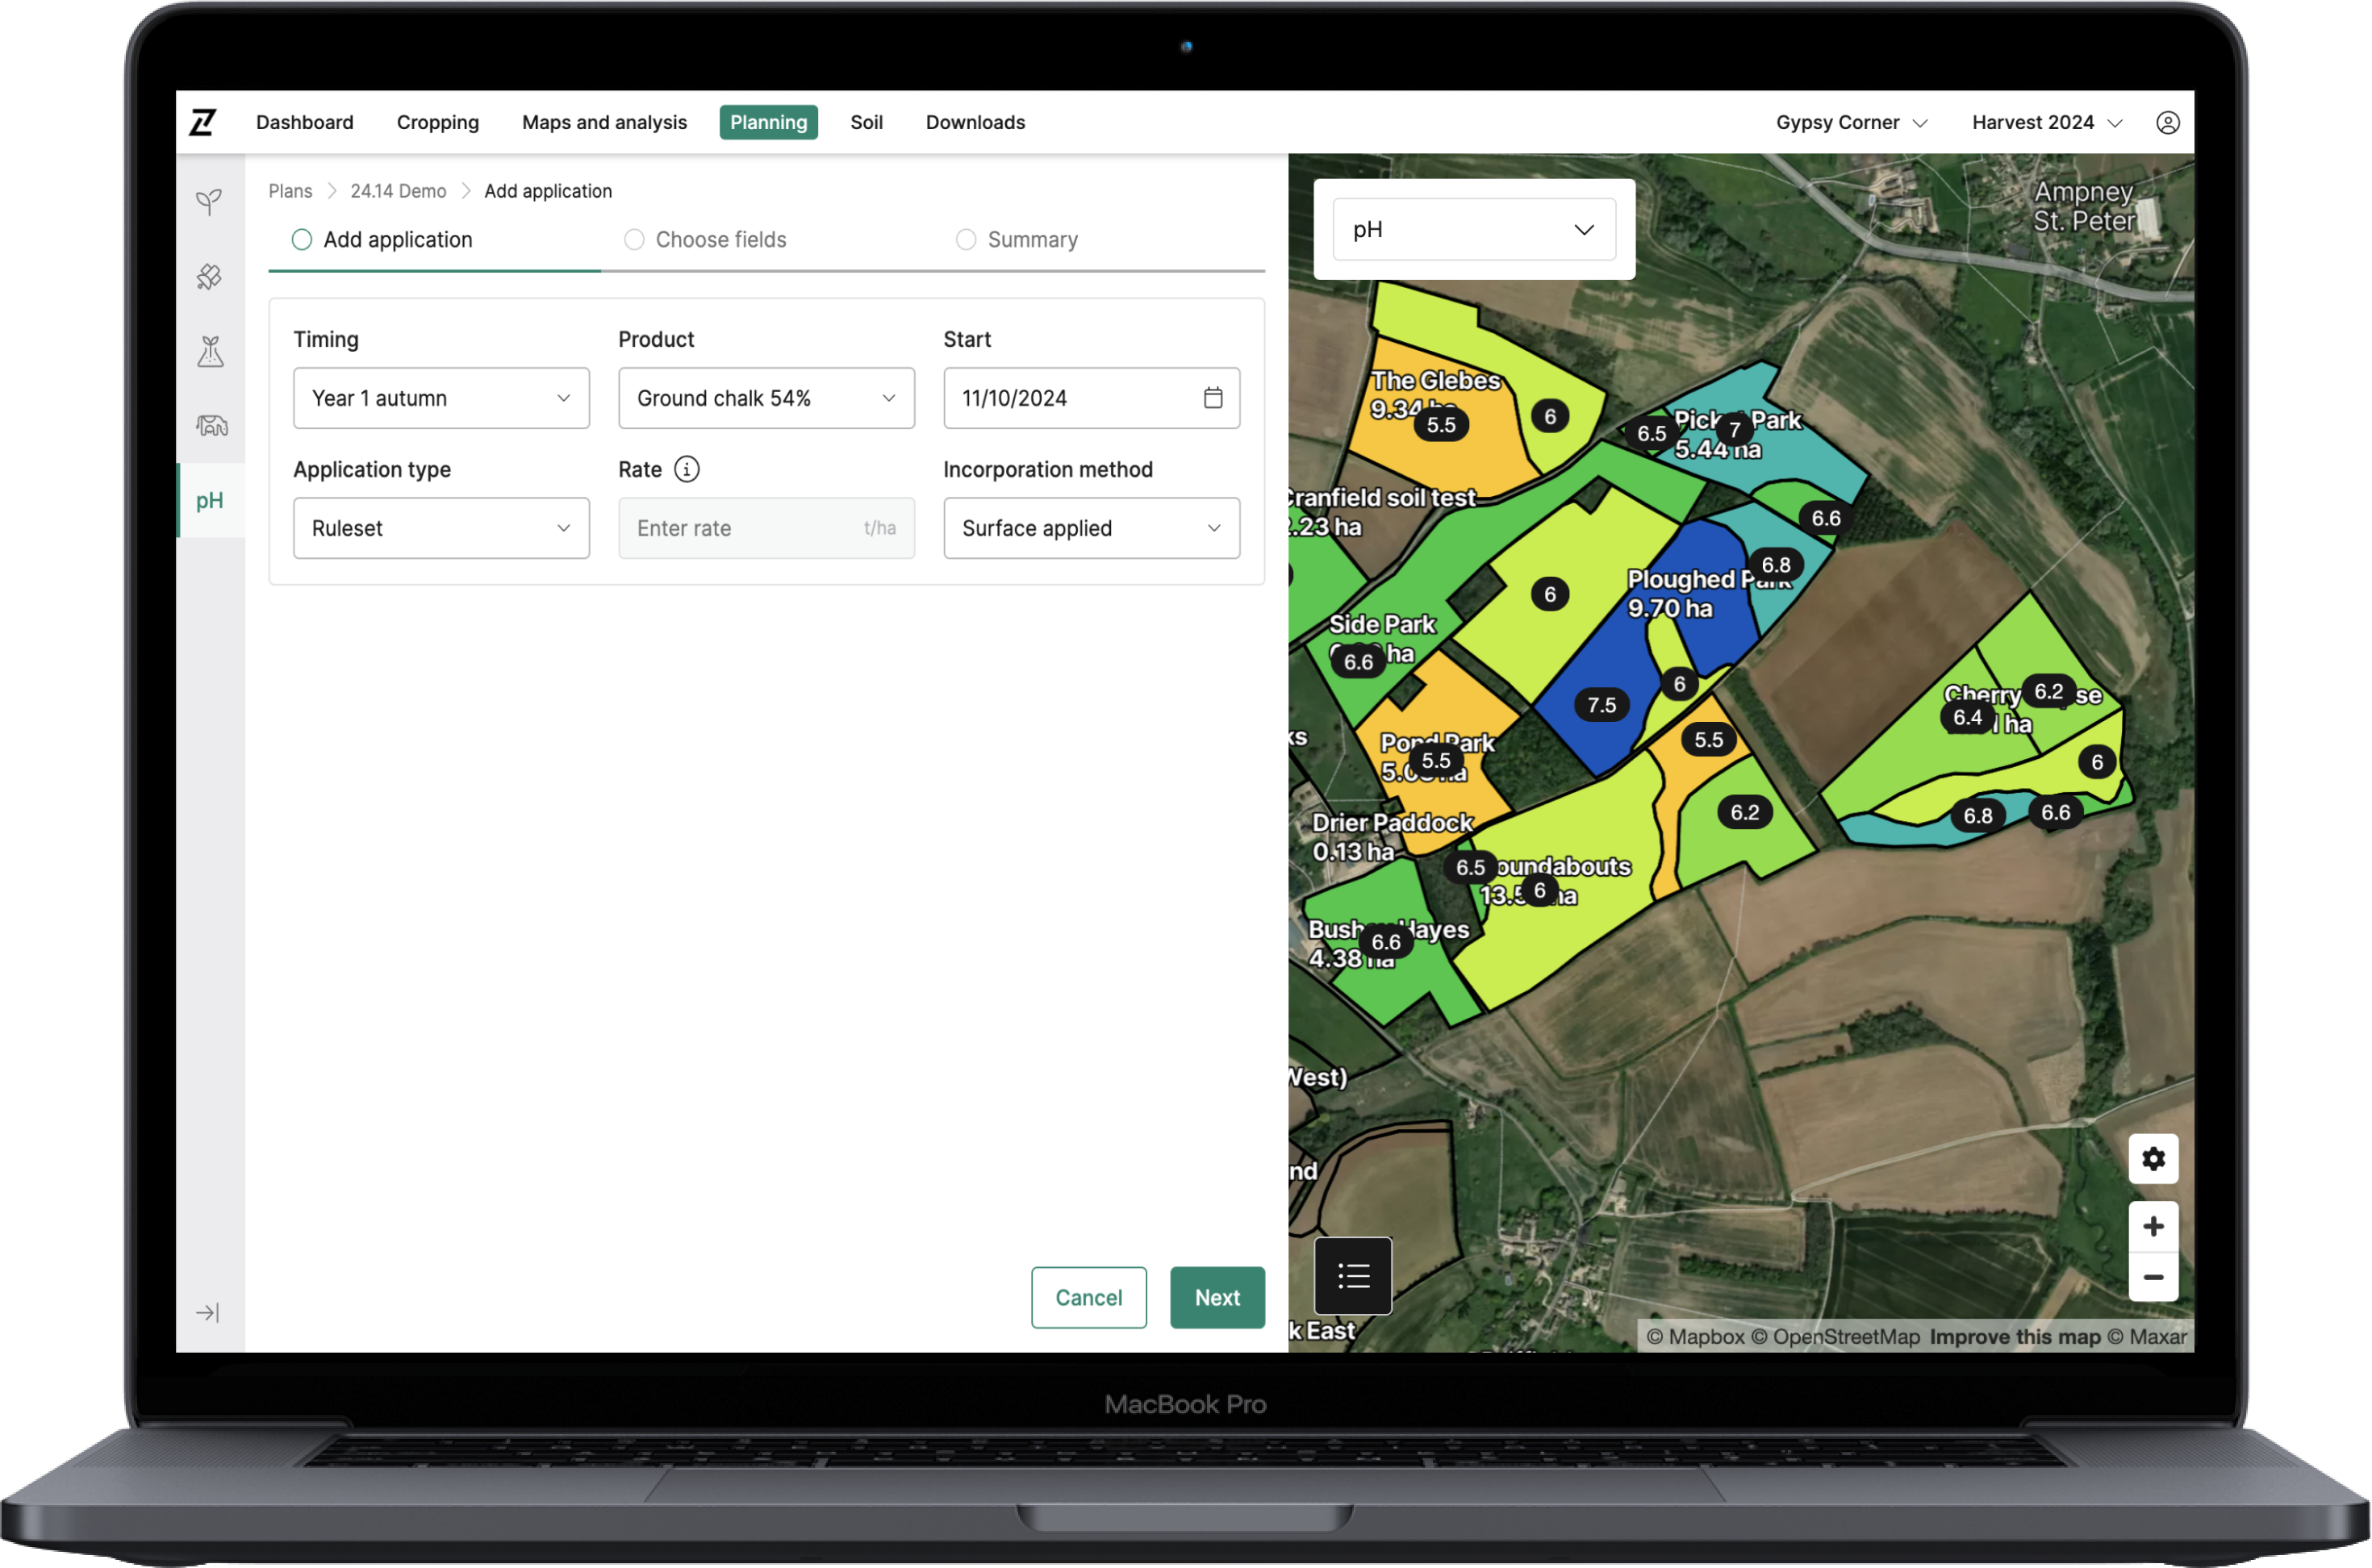
- Improved Nutrient Planner usability on small screens using full screen scroll and collapsable components.
Log in to Contour to check out the updates today, and please send any feedback you may have to info@digital.originenterprises.com to help us keep improving.