Using ‘Big Data’ to improve Phosphate fertiliser applications
Background
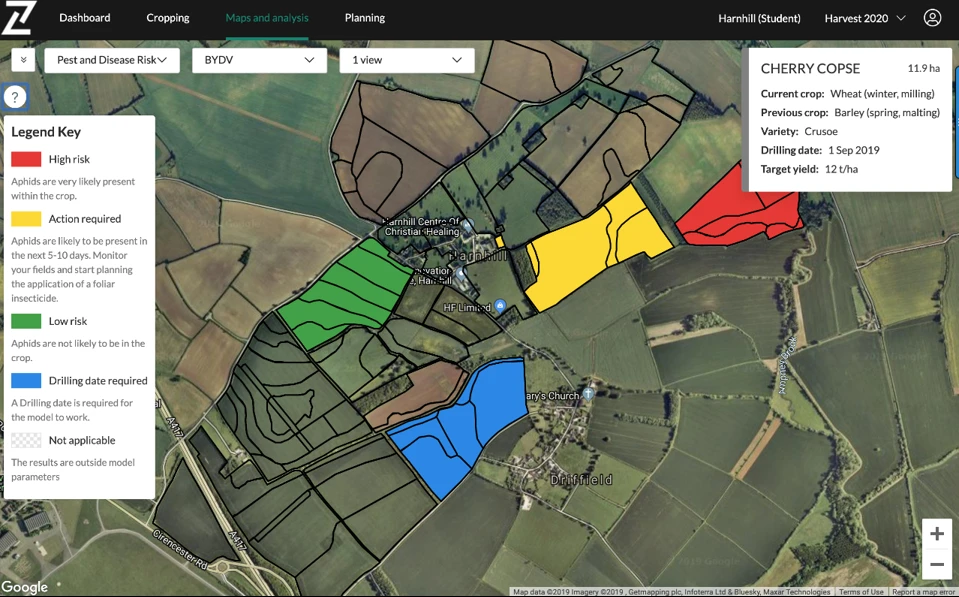
Origin Digital’s Contour platform is used on thousands of farms in the UK. The platform enables farmers, agronomists and precision farming companies to manage complex farm datasets. It converts anonymous big data into actionable information, ensuring farms are efficient and maximising gross margins.
A recent focus on the environmental and agronomic impacts of Phosphorus has driven Origin Digital to embark on a research project. The aim was to discover if our unique datasets could improve or enhance the current RB209 fertiliser recommendations in the UK.
Phosphorus
Phosphorus (P) is one of the essential elements that cannot be replaced and without it crops will not grow, and life would not exist. Its importance started to be recognised in the mid-18th century and in-part led to research, including the 177 year old Broadbalk experiment at Rothamsted Research which is still running. With the recognition that P fertiliser was usually required to produce crops, as a result, it was applied often in excess after crop offtake for decades and this led to a build-up of levels that do not limit crop yield.
Beginning in the 1940s, agronomic soil tests using chemical extractants were developed to estimate the ability of a soil to supply P to plants over a growing season. In England, the “Olsen” P test was adopted and other similar tests are used in other countries. It was used within fertiliser recommendation systems and since the early 1970’s has been included in the “RB209” fertiliser recommendations.
P Fertiliser Recommendations
The aim of the recommendations is to maintain soils at a level sufficient to supply P to the crop to achieve economic optimal yield in most years – for arable soils this is index 2 (16–25mg/l Olsen P). Where levels are too high, no P fertiliser is recommended to ‘run down’ the soil to this level and if too low, additional P fertiliser is recommended to ‘build up’ to index 2. If the soil is at index 2 then a ‘maintenance’ amount of P fertiliser is recommended that replaces the amount of P removed by the crop.
P Behaviour in Soil
Note that the recommendations are to ‘maintain soils at a level sufficient to supply P to the crop’ not to apply a certain amount of P fertiliser for a specific crop. This is very different to nitrogen where non-leguminous crops require N fertiliser to be applied annually to achieve optimum yield. This is due to the very different chemistry of the two elements with nitrogen (and sulphur) being very mobile within the soil while the majority of the Phosphorus (and to a similar extent potassium) is tightly bound to the soil. A very small amount of the total P in the soil is water soluble and available to the crop and this is replenished by readily available P bound to soil particles. It is these two ‘pools’ that Olsen P measures, as indicated below.

When P fertiliser is applied, very little of it gets taken up by the crop that it is applied to – typically only around 5-15%. The remainder is bound up in varying levels of soil particles to be taken up by future crops. The result of this tight binding of P onto the soil particles is that the soil needs to be at a critical level to supply the crop being grown. If it is below this, then applied P fertiliser may be able to claw back some of the yield, but not all.

The fertiliser recommendations in RB209 work on the principle of getting soils to index 2 and maintaining them at this level to minimise the risk of P limiting yield (low) and of environmental damage (high). RB209 P fertiliser recommendations do not vary by soil type. However, it is recognised that different soils will bind and release P to different levels and therefore the inflexion point will be different. To complicate the issue, the crop, weather, and for example pH status will also play a role in P availability and as a result crop performance.
This provides an opportunity for “Big Data Analysis” – where there is enough data that can be analysed to determine whether it is possible to develop more refined P management strategies.
The Research
Origin Digital (formerly known as AgSpace), Nottingham University, and The British Geological Society conducted the research between 2017 and 2019. It is believed that this is the largest study of its kind in the UK. The full published paper can be reviewed here.
The research covered 3 years’ worth of wheat yield mapping and precision soil analysis data (2015-2017). It includes approximately 21,000 fields and soil management zones. Boundary Line Analysis (BLA), is a method used to model the maximum yield that is found in a data set at any given value of a variable such as nutrient concentration in the soil. We found that the yield boundary increased linearly with soil P concentration up to some inflection point. We interpret this model as indicating the potential for P limitation on yield at concentrations smaller than the inflexion point.

For winter wheat, the inflection point varied in each year due to seasonal conditions, it ranged from P Index 1.8 – 2.2 over the three study years.
Where calcareous or high pH soils were present (>7.5 pH) the inflection point occurred at a higher level of Olsen P, suggesting that on high pH soils, we should maintain a slightly higher P index (2.2) to reduce the risk of yield loss. It was also discovered that in P limiting years, where soils were shallow over chalk or limestone, and high pH, the inflection point could be as high as P index 3.2.
Where non-calcareous soils (<7.0 pH) were present the inflection point was lower in 2 of the 3 years, ranging between a P Index 1.5 and 1.8. This suggests that on non-calcareous soils, managing P at an index of 1.8 should incur no yield loss.
Where soil indexes fall below the inflection point farmers are at risk of P limiting yield, by up to 50% in some cases. Other factors like annual weather events will impact the maximum potential yield gap, but it is advised to always maintain P levels at or slightly above the inflection point for your specific soil type.
Cropping rotation should also be considered. The research was carried out on fields in winter wheat and – for example – spring crops with smaller root systems and more rapid growth may have an inflection point at a higher P level. This needs to be taken into consideration when deciding on P fertilisation strategy as it usually takes multiple years to change soil P levels. We will carry out further big data analysis to continue to learn from the data and refine fertiliser strategies for inclusion in Contour.
Next steps for P fertiliser recommendations in Contour
Origin Digital has developed the RB209 fertiliser recommendation system into the Contour platform which allows farmers and agronomists to create precision fertiliser recommendations. This saves farmers money and ensures maximum potential yields are achieved.
We believe that users of our Contour platform should be at the cutting edge, taking the best advice available to grow crops in more sustainable and profitable ways.
With this in mind we are embarking on a new development to enable users to update the current RB209 Phosphate recommendations in Contour to factor in the effect of soil type on the target index for Phosphate. We hope this research will help farmers across the UK and beyond manage phosphate levels in their soils with confidence.

