Variable rate nutrition from space
Nitrogen – the mobile nutrient
Nutrient recommendations from soil analysis focus on phosphate, potash and magnesium, which are stable nutrients held by the soil and available for crop uptake over time. In our previous blog we highlighted the value of intelligent nutrient management and our work at Origin Digital, taking soil analysis results from multiple countries using local analysis methods, and providing nutrient recommendations for a range of crops.
These stable nutrients contrast with another key macro nutrient – Nitrogen. Nitrogen is extremely important for plant growth, requiring careful management and balancing. During active growing periods it is required for vegetative canopy growth, grain yield and quality. Too little will cause crops to turn yellow or pale green, become stunted, and mature early before reaching full potential. Too much can cause lodging, increase disease risk, and reduce canopy light interception.
Nitrogen is the most complex nutrient in its behaviour, and the nitrogen cycle highlights its mobile nature in the number of different ways in which it is mineralised, immobilised, transformed and lost from the system.
There are three processes through which nitrogen is lost from the cycle:
- Leaching – the loss of nitrogen through the soil profile, where rainfall exceeds field capacity.
- Denitrification – the conversion of nitrate to nitrous oxide, a major greenhouse gas which is then released into the atmosphere. Occurs in anaerobic conditions, usually in waterlogged soils or following high levels of rainfall.
- Volatilisation – the conversion of ammonium to ammonia gas. Occurs in rapidly drying soils, with the rate further increased by high pH conditions and high levels of calcium.
The loss of nitrogen through each of these processes has negative environmental impacts and decreases the amount of crop available nitrogen in the soil solution, potentially reducing yield and grain quality.
There are also immobilisation and mineralisation processes in the nitrogen cycle which can lock up and release nitrogen throughout the season. The speed of these processes depends on several management factors such as cultivation systems, management of crop residues and C:N ratios of organic inputs. They are also greatly affected by environmental factors including soil moisture and temperature.
In our nutrient recommendations, we consider the previous crop, soil type and rainfall to predict the amount of residual nitrogen available for the following crop. We then assess the crop we wish to grow and the target yield to provide an accurate nitrogen recommendation.
However, as all growers can testify, every season is different in terms of the weather, and every field varies in terms of yield, soil type and historical management.
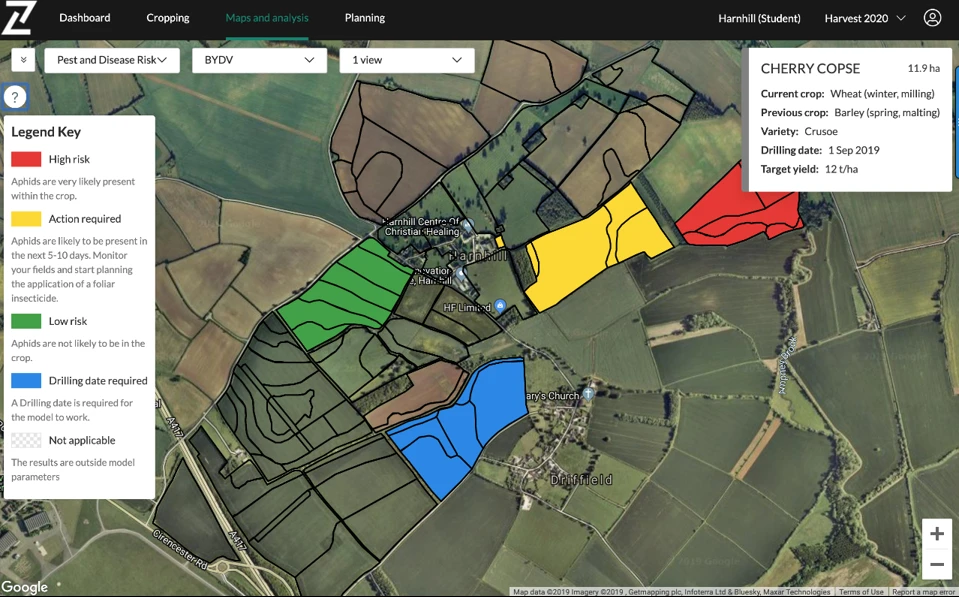
All these processes and factors work together to create variability in the amount of nitrogen available to the crop, and one of the tools we can use to manage this is satellite imagery in Contour and image-based planning. Let’s first look at how we can use Normalised Difference Vegetation Index (NDVI) imagery to better understand our crop, and then how we can vary our nitrogen applications to manage our crop early in the season.
NDVI imagery explained
NDVI is a globally used remote sensing measurement, used for analysing green vegetation. NDVI is calculated from the visible (Red) and Near-InfraRed (NIR) light reflected by vegetation. Healthy vegetation absorbs most of the visible light that hits it and reflects a large portion of the near-infrared light. Unhealthy or sparse vegetation reflects more visible light and less near-infrared light. NDVI is a ratio with values ranging between -1 to 1, where negative values represent water, values around zero represent bare soil and values greater than zero represent vegetation (0.1 to 1).
NDVI = (NIR — RED) / (NIR + RED)

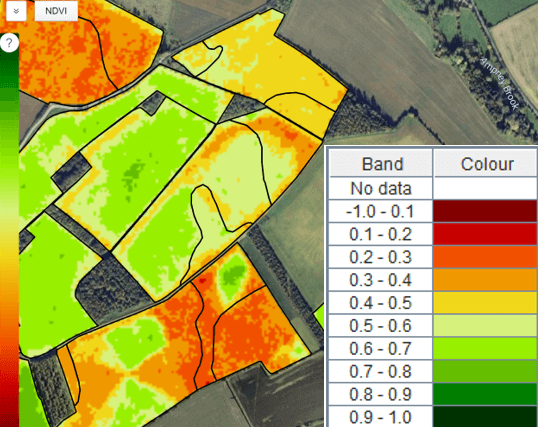
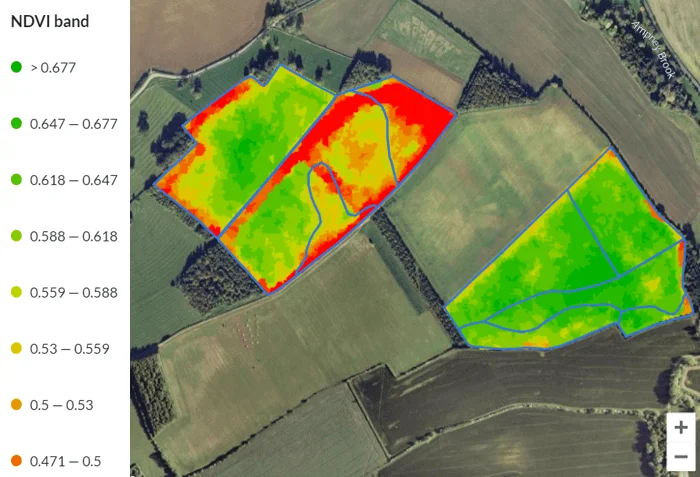
NDVI imagery on the ‘Maps and Analysis’ page in Contour is displayed on a 10-band colour scale in 0.1 increments (Fig.2). This changes in our image-based planning tool, where we focus on the selected fields and discard the unused NDVI values above and below the maximum and minimum for those fields. Once we have focused on the NDVI values for those fields, we can set the number of image bands (and rates) which are used in the plan (Fig.3). The NDVI image is then split into equally spaced bands, with the minimum, maximum and target rates assigned to corresponding NDVI bands (based on whether we have selected canopy levelling or optimum yield), along with interval values if more than three bands are set.
Taking this approach allows growers to walk their fields and make decisions on nitrogen rates for the lowest, highest and average biomass of the field, and then allow Contour to distribute the rates accordingly based on the spread of the NDVI values.
Let’s look in more detail at how we can use Contour for our early nitrogen applications and level up our crop canopy.
Early season nitrogen – Canopy levelling
Step 1 – Identify the issue – Contour Mobile scouting
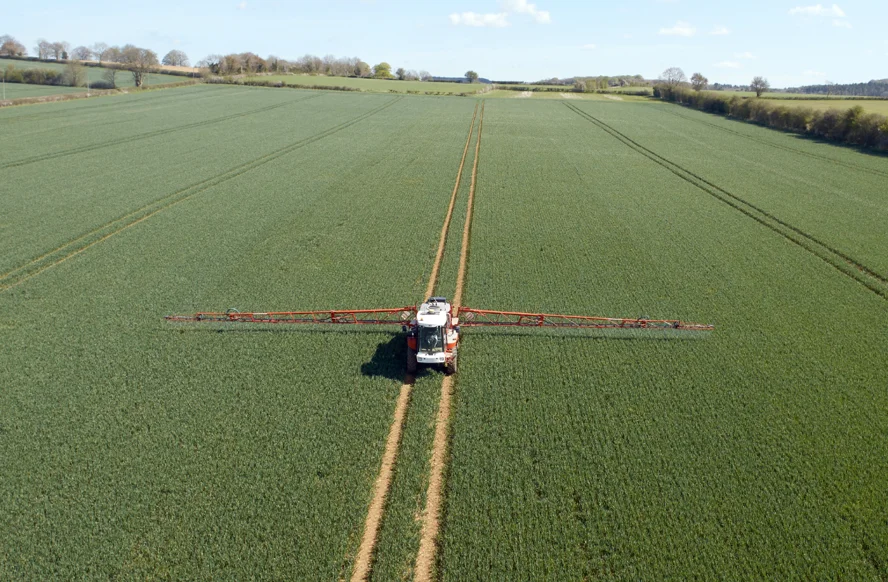
Early in spring we see crop variation due to differences in establishment, nitrogen availability, soil type and more. Before we try to address any variation in the field, we need to understand what the cause is. Using Contour Mobile, we can access the latest satellite imagery for our fields, and easily identify and locate the high and low biomass areas to examine and understand what might be causing variation in the crop.
Regarding nitrogen, there may be varying quantities available due to several reasons; overwinter rainfall, crop residue or organic inputs (immobilising and mineralising nitrogen), or soil type (texture, organic matter, depth, etc.). This can lead to some areas of the field looking less vigorous and containing less biomass than others. This is the type of variation we can then manage with variable nitrogen. However, if the cause of low biomass is pest damage or phosphate deficiency, then simply applying more nitrogen will not solve these issues, and there is a good chance we will be wasting nitrogen if we attempt to increase canopy size and biomass by applying more.
If we have identified lower quantities of crop available nitrogen, we can then use image-based planning in Contour to boost the areas of low biomass and create a more even and level crop canopy.
Step 2 – Decide nitrogen rates – Canopy levelling
Applying more nitrogen in areas with lower biomass can help to boost canopy growth, increase biomass and improve tiller survival rates. If there are areas of the field which have access to large amounts of available nitrogen from the soil, these can become too thick and applying more nitrogen could lead to problems with light interception, disease resistance and lodging later in the season. In these areas we can reduce our nitrogen application rates to prevent the crop becoming difficult to manage.
Step 3 – Create a variable rate plan in Contour and apply
Create your variable rate plan in Contour, using the easy four step process:
- Select your satellite image.
- Select your application options – Product, timing, estimated application date.
- Select rate options and calculate – Set min, max and target rates and the number of bands/rates to use.
- Review and export the plan – Review product and nutrient averages and totals. Export variable rate GPS files and import into your tractor, spreader or sprayer screen.
Step 4 – Monitor the crop
Use Contour and Contour Mobile to monitor the crop variation and changes as a result of the variable rate application. Where areas of low biomass have increased, we can assume this response is due to more available nitrogen from our higher N rate. If there has been no response from the lower biomass areas to the increased nitrogen application, further investigations may be necessary through tissue and soil sampling to understand other underlying issues.
In our higher biomass areas, if these are still on or ahead of target, we can assume there is enough available nitrogen from the soil and either apply a standard rate or a reduced rate for second applications. Make this decision based on the canopy size in relation to growth stage.
Before the second application, repeat the process of using Contour Mobile to identify and locate the high and low biomass areas. Aim to apply more nitrogen to areas of lower biomass if these are still behind (and with no other factors restricting growth) and reduce if ahead of target for the growth stage.
These earlier applications focus on evening up the crop canopy, to ensure that we have the optimum canopy structure for grain and seed production later in the season. In our final applications, we aim to use variable nitrogen to optimise yield by setting nitrogen rates to match the yield potential of the crop. This will utilise Green Chlorophyll Vegetation Index (GCVI) imagery, which is more accurate than NDVI at determining yield potential later in the season, when the crop canopy is fully developed.
You can find more information about Contour here:
https://34.244.110.156/contour/